← Who reports today · Industrials
WAB · Q2 2026
Archived report (Q2 2026). Latest deep dive →
The quarter in brief
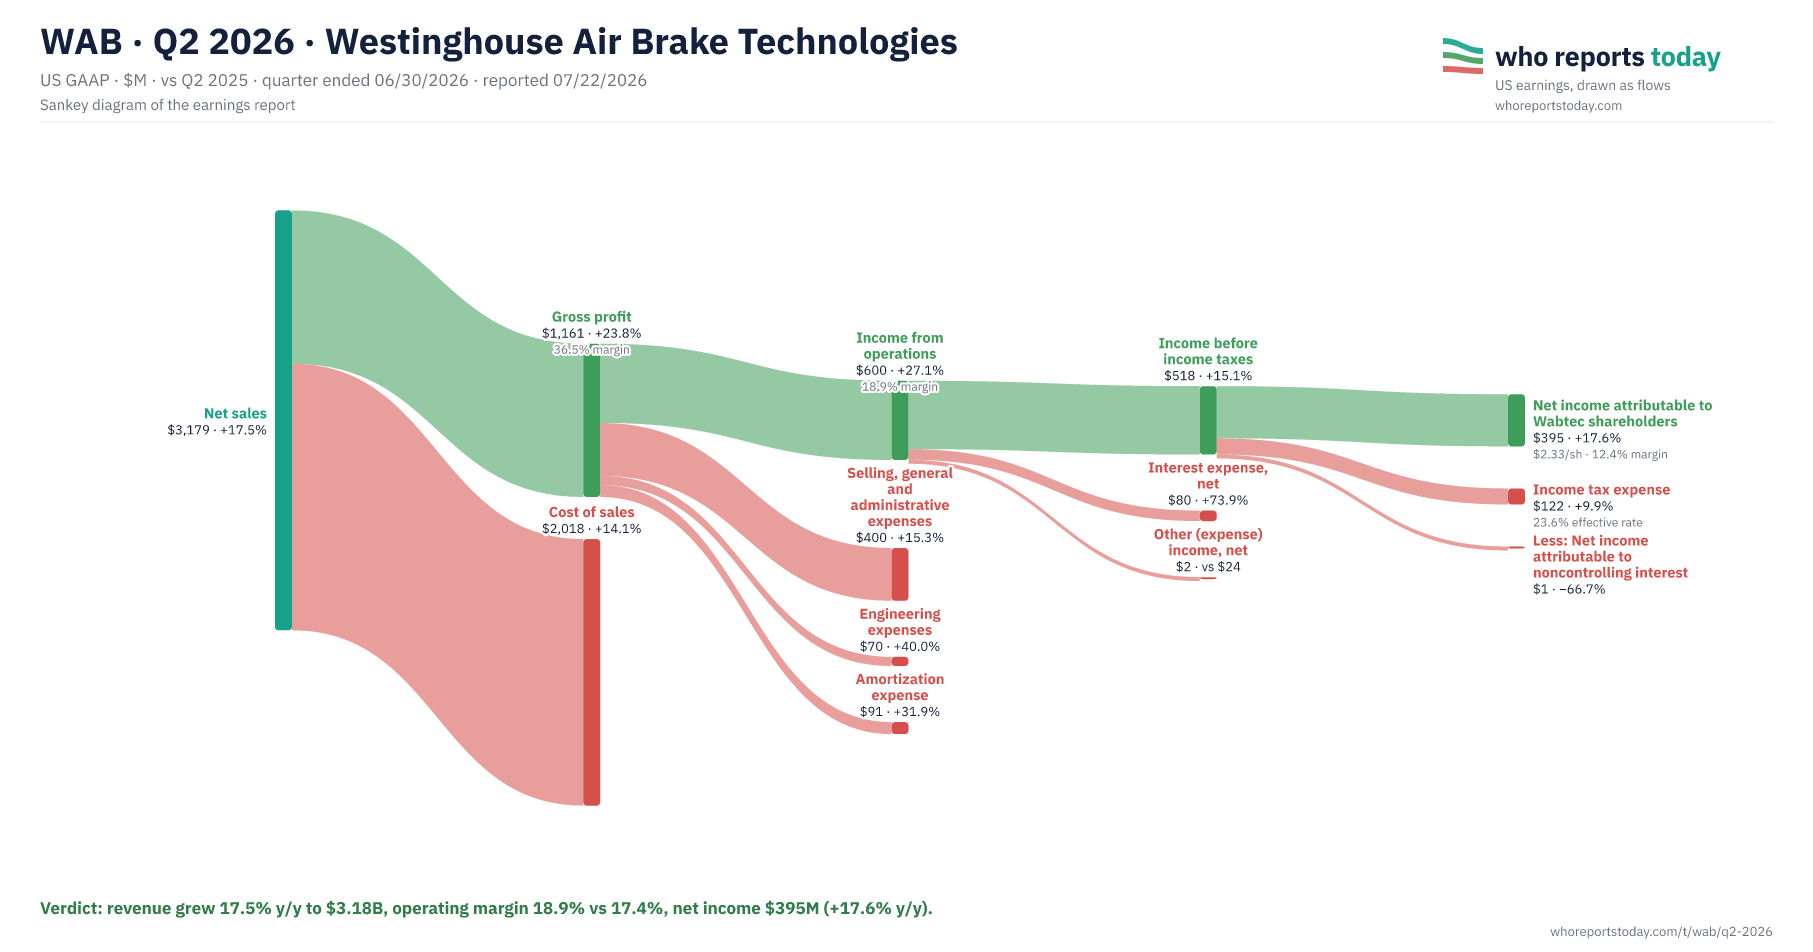
Revenue grew 17.5% y/y to $3.18B, operating margin 18.9% vs 17.4%, net income $395M (+17.6% y/y).
Net income attributable to Wabtec shareholders
$395M
up 17.6% y/y
Net sales
$3,179M
up 17.5% y/y
Income from operations
$600M
up 27.1% y/y
Gross profit
$1,161M
up 23.8% y/y
All figures in $M.
| Line item | Amount and change |
|---|---|
| Net sales | $3,179 · +17.5% |
| Cost of sales | $2,018 · +14.1% |
| Gross profit | $1,161 · +23.8% · 36.5% margin |
| Selling, general and administrative expenses | $400 · +15.3% |
| Engineering expenses | $70 · +40.0% |
| Amortization expense | $91 · +31.9% |
| Income from operations | $600 · +27.1% · 18.9% margin |
| Interest expense, net | $80 · +73.9% |
| Other (expense) income, net | $2 · vs $24 |
| Income before income taxes | $518 · +15.1% |
| Income tax expense | $122 · +9.9% · 23.6% effective rate |
| Less: Net income attributable to noncontrolling interest | $1 · −66.7% |
| Net income attributable to Wabtec shareholders | $395 · +17.6% · $2.33/sh · 12.4% margin |
Verdict: revenue grew 17.5% y/y to $3.18B, operating margin 18.9% vs 17.4%, net income $395M (+17.6% y/y).
Adjusted diluted EPS was $2.76, up 21.6%.
Source and notation
Source: Westinghouse Air Brake Technologies press release, 8-K EX-99.1 of 07/22/2026 (SEC EDGAR). Every figure was matched against the income statement in the release and checked against SEC XBRL.
Cite / embed this chart
Free to use in articles, research and social posts with credit to Who Reports Today and a link — licensed under CC BY 4.0 (terms).
Chart: “WAB Q2 2026: where the revenue went” by Who Reports Today, https://whoreportstoday.com/t/wab/q2-2026. Licensed under CC BY 4.0.
<figure>
  <a href="https://whoreportstoday.com/t/wab/q2-2026"><img src="https://whoreportstoday.com/t/wab/q2-2026/sankey.png" alt="WAB Q2 2026: where the revenue went" loading="lazy" style="max-width:100%;height:auto"></a>
  <figcaption>Source: <a href="https://whoreportstoday.com/t/wab/q2-2026">Who Reports Today</a>, licensed under <a href="https://creativecommons.org/licenses/by/4.0/">CC BY 4.0</a></figcaption>
</figure>
https://whoreportstoday.com/t/wab/q2-2026/sankey.png
<a href="https://whoreportstoday.com/t/wab/q2-2026">WAB Q2 2026 earnings chart (Who Reports Today)</a>
This is an archived report: the image at this link won’t change. If you change the chart (crop, translate), say so in the credit. Company logos and trademarks are not covered by the license.
- The multi-year backlog was $30.93 billion, and 12-month backlog grew 11.3%.
- Gross margin was 36.5% vs 34.7% a year earlier.
- Operating income was $600M, a 18.9% margin vs 17.4% a year earlier.
- The effective tax rate was 23.6% vs 24.7% a year earlier.
- Diluted EPS was $2.33 vs $1.96 a year earlier.
What distorts the picture in this report and what to watch beyond the headlines.
More reports: WM · Q2 2026 · XYL · Q2 2026 · ADP · FQ4 2026 · ALLE · Q2 2026 · AME · Q2 2026 · AOS · Q2 2026 · AXON · Q2 2026 · BA · Q2 2026 · BE · Q2 2026 · BR · Q4 FY2026 · all reports