← Who reports today · Financials
CB · Q2 2026
Archived report (Q2 2026). Latest deep dive →
The quarter in brief
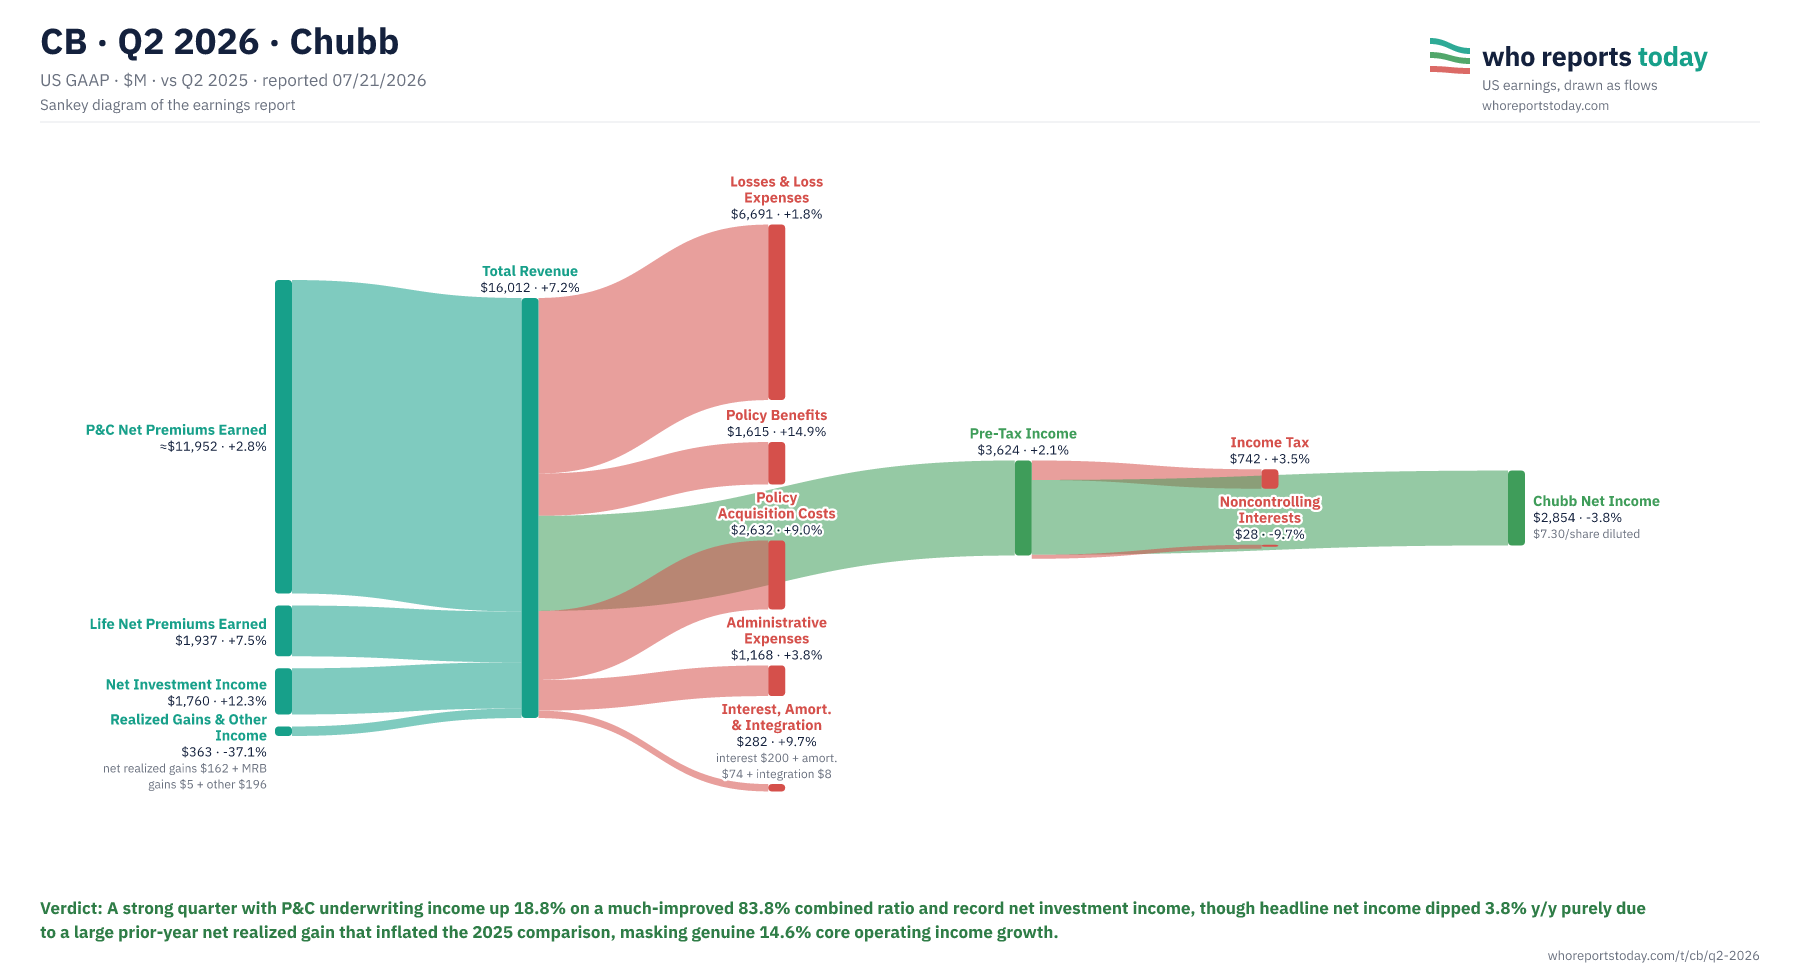
A strong quarter with P&C underwriting income up 18.8% on a much-improved 83.8% combined ratio and record net investment income, though headline net income dipped 3.8% y/y purely due to a large prior-year net realized gain that inflated the 2025 comparison, masking genuine 14.6% core operating income growth.
Chubb Net Income
$2,854M
down 3.8% y/y
Total Revenue
$16,012M
up 7.2% y/y
All figures in $M.
| Line item | Amount and change |
|---|---|
| P&C Net Premiums Earned | ≈$11,952 · +2.8% |
| Life Net Premiums Earned | $1,937 · +7.5% |
| Net Investment Income | $1,760 · +12.3% |
| Realized Gains & Other Income | $363 · -37.1% · net realized gains $162 + MRB gains $5 + other $196 |
| Total Revenue | $16,012 · +7.2% |
| Losses & Loss Expenses | $6,691 · +1.8% |
| Policy Benefits | $1,615 · +14.9% |
| Policy Acquisition Costs | $2,632 · +9.0% |
| Administrative Expenses | $1,168 · +3.8% |
| Interest, Amort. & Integration | $282 · +9.7% · interest $200 + amort. $74 + integration $8 |
| Pre-Tax Income | $3,624 · +2.1% |
| Income Tax | $742 · +3.5% |
| Noncontrolling Interests | $28 · -9.7% |
| Chubb Net Income | $2,854 · -3.8% · $7.30/share diluted |
Verdict: A strong quarter with P&C underwriting income up 18.8% on a much-improved 83.8% combined ratio and record net investment income, though headline net income dipped 3.8% y/y purely due to a large prior-year net realized gain that inflated the 2025 comparison, masking genuine 14.6% core operating income growth.
Operating cash flow $3.73B (adjusted $3.48B); Q2 capital returned to shareholders $1.37B ($979M buybacks + $395M dividends); management sees property growth penalty dissipating, confident in continued double-digit tangible book value growth.
Source and notation
* marks non-cash / ≈ estimated. Source: Chubb Limited press release / 10-Q (SEC EDGAR).
Cite / embed this chart
Free to use in articles, research and social posts with credit to Who Reports Today and a link — licensed under CC BY 4.0 (terms).
Chart: “CB Q2 2026: where the revenue went” by Who Reports Today, https://whoreportstoday.com/t/cb/q2-2026. Licensed under CC BY 4.0.
<figure>
  <a href="https://whoreportstoday.com/t/cb/q2-2026"><img src="https://whoreportstoday.com/t/cb/q2-2026/sankey.png" alt="CB Q2 2026: where the revenue went" loading="lazy" style="max-width:100%;height:auto"></a>
  <figcaption>Source: <a href="https://whoreportstoday.com/t/cb/q2-2026">Who Reports Today</a>, licensed under <a href="https://creativecommons.org/licenses/by/4.0/">CC BY 4.0</a></figcaption>
</figure>
https://whoreportstoday.com/t/cb/q2-2026/sankey.png
<a href="https://whoreportstoday.com/t/cb/q2-2026">CB Q2 2026 earnings chart (Who Reports Today)</a>
This is an archived report: the image at this link won’t change. If you change the chart (crop, translate), say so in the credit. Company logos and trademarks are not covered by the license.
- GAAP net income fell 3.8% y/y only because Q2 2025 included a much larger net realized/other gain vs Q2 2026; core operating income, which strips these out, rose 14.6% and per-share core operating income rose 18.2%.
- P&C underwriting income of $1.94B (+18.8%) benefited from lower catastrophe losses ($475M vs $630M) and higher favorable prior period development ($283M vs $249M).
- North America Commercial NPW fell 2.3% driven by a 9.0% decline in major accounts/E&S property from deliberate underwriting actions on soft property pricing; excluding that, commercial growth was +4.1%.
- Overseas General grew 10.2% (4.8% constant currency) with broad strength across Latin America (+15.6%), Asia (+12.0%) and Europe (+5.1%), and its combined ratio improved 8.1 points to 82.2%.
- Net investment income hit a record $1.76B pre-tax (+12.3%), with adjusted net investment income at $1.88B (+11.4%), supported by fixed income and alternative asset performance as invested assets grew 9% y/y to $175B.
- Life Insurance segment income rose 9.0% to $332M, led by International Life (+13.0%); life premiums and deposits collected rose 14.4% to $2.65B, though deposits aren't recognized as GAAP revenue.
What distorts the picture in this report and what to watch beyond the headlines.
CB — Chubb is a global insurance company offering property and casualty, accident and health, and reinsurance products.
It is headquartered in Zurich, Switzerland, with major operations in North America and other regions.
More reports: CFG · Q3 2026 · CINF · Q2 2026 · CME · Q3 2026 · COF · Q3 2026 · COIN · Q2 2026 · CPAY · Q2 2026 · EG · Q2 2026 · ERIE · Q2 2026 · FDS · Q4 FY2026 · FIS · Q2 2026 · all reports