← Who reports today · Health Care
ELV · Q2 2026
Archived report (Q2 2026). Latest deep dive →
The quarter in brief
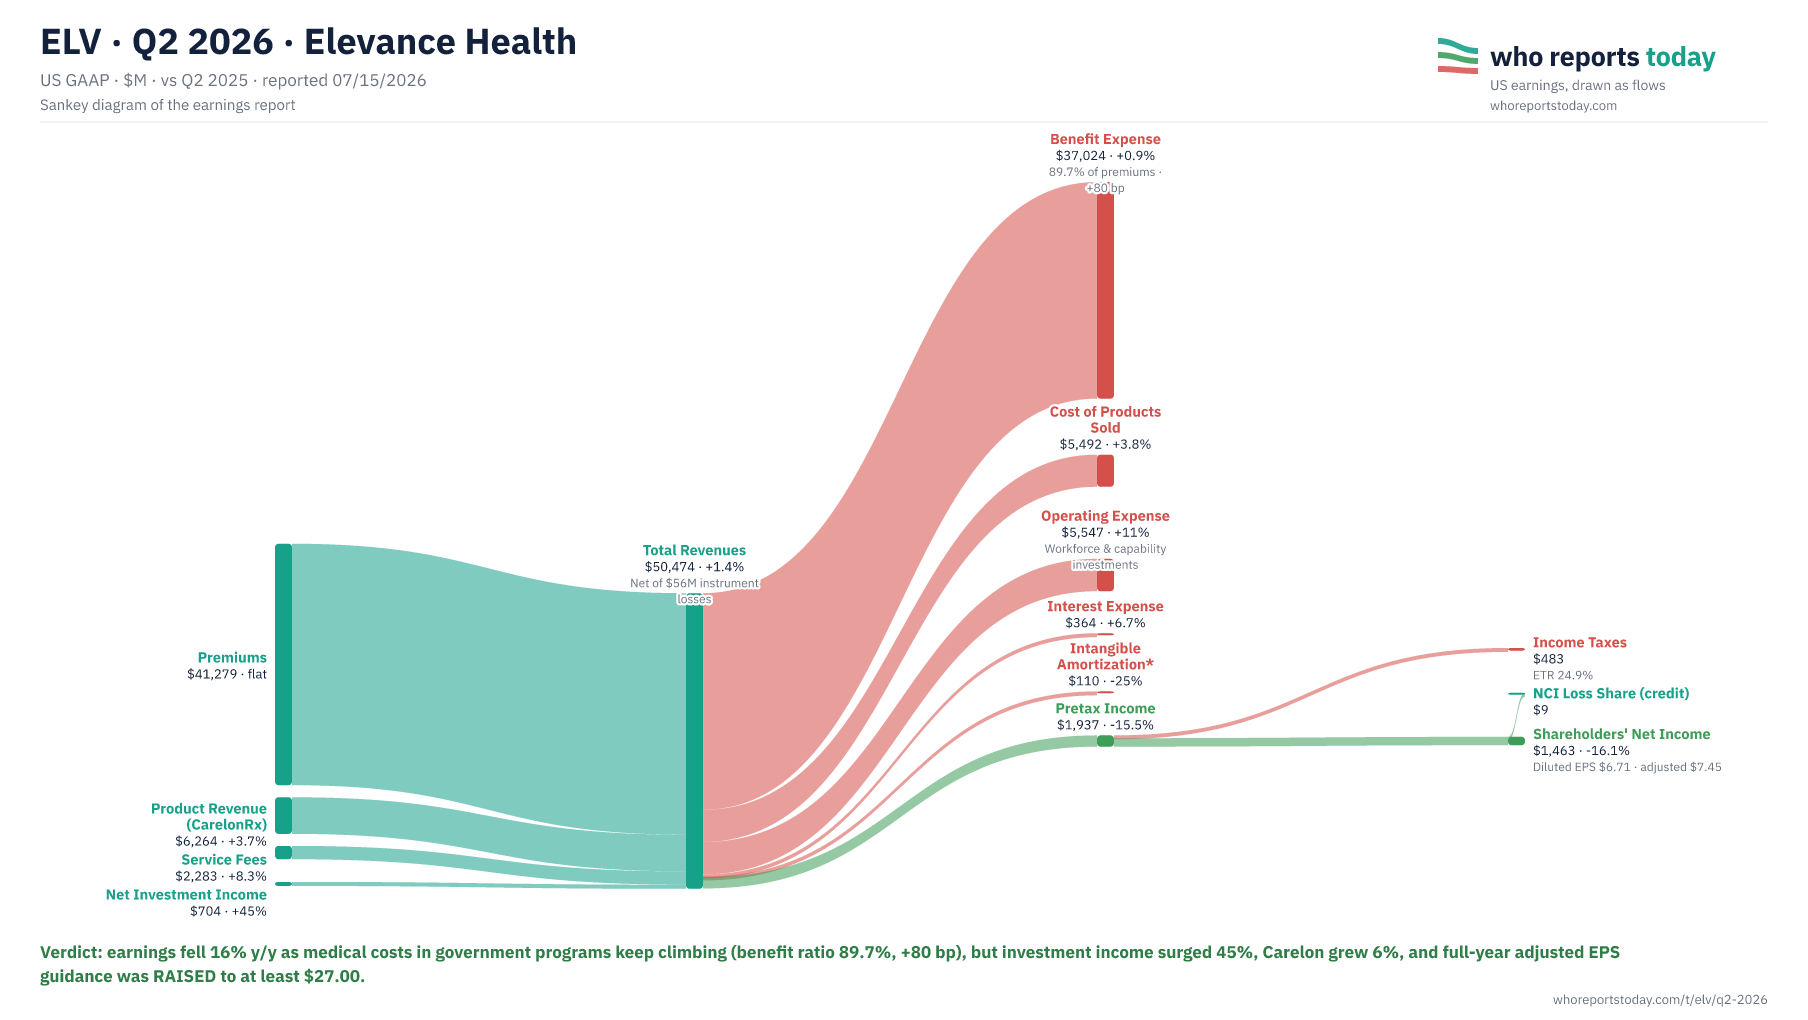
Earnings fell 16% y/y as medical costs in government programs keep climbing (benefit ratio 89.7%, +80 bp), but investment income surged 45%, Carelon grew 6%, and full-year adjusted EPS guidance was RAISED to at least $27.00.
Total Revenues
$50,474M
up 1.4% y/y
Operating Expense
$5,547M
up 11% y/y
All figures in $M.
| Line item | Amount and change |
|---|---|
| Premiums | $41,279 · flat |
| Product Revenue (CarelonRx) | $6,264 · +3.7% |
| Service Fees | $2,283 · +8.3% |
| Net Investment Income | $704 · +45% |
| Total Revenues | $50,474 · +1.4% · Net of $56M instrument losses |
| Benefit Expense | $37,024 · +0.9% · 89.7% of premiums · +80 bp |
| Cost of Products Sold | $5,492 · +3.8% |
| Operating Expense | $5,547 · +11% · Workforce & capability investments |
| Interest Expense | $364 · +6.7% |
| Intangible Amortization* | $110 · -25% |
| Pretax Income | $1,937 · -15.5% |
| Income Taxes | $483 · ETR 24.9% |
| NCI Loss Share (credit) | $9 |
| Shareholders' Net Income | $1,463 · -16.1% · Diluted EPS $6.71 · adjusted $7.45 |
Verdict: earnings fell 16% y/y as medical costs in government programs keep climbing (benefit ratio 89.7%, +80 bp), but investment income surged 45%, Carelon grew 6%, and full-year adjusted EPS guidance was RAISED to at least $27.00.
Benefit expense ratio 89.7% · adjusted diluted EPS $7.45 · FY26 guidance raised: GAAP EPS ≥$20.10, adjusted ≥$27.00 · medical membership 44.9M (−469K q/q).
Source and notation
* marks non-cash / ≈ estimated. Total revenues are net of $56M losses on financial instruments. Source: Elevance Health press release, 8-K EX-99 (SEC EDGAR).
Cite / embed this chart
Free to use in articles, research and social posts with credit to Who Reports Today and a link — licensed under CC BY 4.0 (terms).
Chart: “ELV Q2 2026: where the revenue went” by Who Reports Today, https://whoreportstoday.com/t/elv/q2-2026. Licensed under CC BY 4.0.
<figure>
  <a href="https://whoreportstoday.com/t/elv/q2-2026"><img src="https://whoreportstoday.com/t/elv/q2-2026/sankey.png" alt="ELV Q2 2026: where the revenue went" loading="lazy" style="max-width:100%;height:auto"></a>
  <figcaption>Source: <a href="https://whoreportstoday.com/t/elv/q2-2026">Who Reports Today</a>, licensed under <a href="https://creativecommons.org/licenses/by/4.0/">CC BY 4.0</a></figcaption>
</figure>
https://whoreportstoday.com/t/elv/q2-2026/sankey.png
<a href="https://whoreportstoday.com/t/elv/q2-2026">ELV Q2 2026 earnings chart (Who Reports Today)</a>
This is an archived report: the image at this link won’t change. If you change the chart (crop, translate), say so in the credit. Company logos and trademarks are not covered by the license.
- The y/y profit decline (−16%) is a medical-cost story: benefit expense ratio rose 80 bp to 89.7% on elevated cost trend in Medicare Advantage and Medicaid, partially offset by better Individual ACA performance.
- Guidance went UP anyway: full-year adjusted EPS raised to at least $27.00 (GAAP ≥$20.10) — the quarter carried ≈$0.80 per share of net below-the-line benefit, mostly investment income up 45% to $704M.
- Premiums were flat ($41.3B) as higher premium yields offset planned membership declines; medical membership fell 469K sequentially to 44.9M on a commercial fee-based customer transition and ACA/Medicaid attrition.
- Carelon is the growth engine: operating revenue +6% to $19.2B on risk-based Carelon Services and CarelonRx product revenue (+3.7% product line).
- Operating expense jumped 11% (ratio +100 bp to 11.1%) — deliberate investments in workforce and long-term capabilities, not cost slippage per management.
- Buybacks cut diluted shares 3.5% y/y to 217.9M, cushioning EPS (−13.1%) versus net income (−16.1%).
- Intangible amortization fell 25% to $110M and financial-instrument losses narrowed to $56M from $131M — smaller below-the-line drags than a year ago.
What distorts the picture in this report and what to watch beyond the headlines.
ELV — Elevance Health is a managed healthcare company offering medical, pharmacy, and behavioral health benefits.
It serves members across the United States through brands like Anthem and operates from Indianapolis, Indiana.
More reports: EW · Q2 2026 · GEHC · Q2 2026 · GILD · Q2 2026 · HCA · Q2 2026 · HSIC · Q2 2026 · HUM · Q2 2026 · IDXX · Q2 2026 · ILMN · Q2 2026 · INCY · Q2 2026 · IQV · Q2 2026 · all reports