Health Care
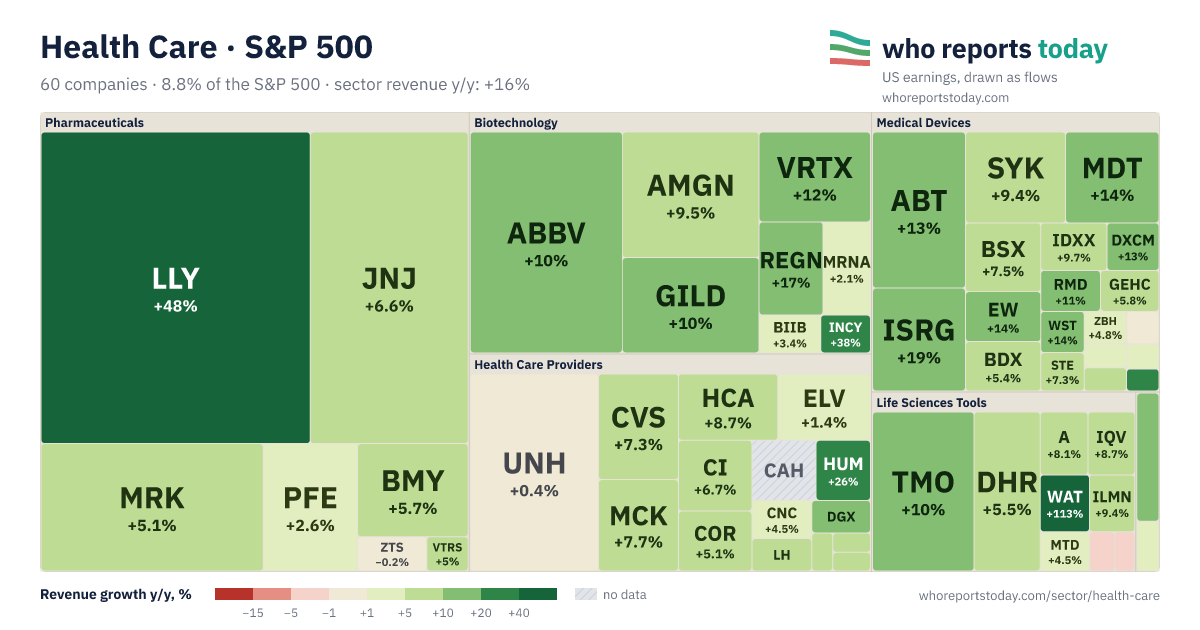
Share of the S&P 500 — 8.8% by market cap · 60 companies, sorted by weight. “deep dive →” marks a full earnings card.
Companies: index weight and revenue growth
Sector revenue growth y/y (weighted by index share): +16%
Color scale
How to read the map
Rectangle size is the company’s share of the S&P 500; together they make up the whole sector. On a wide screen companies are grouped by GICS industry, labelled above each group. The tiniest ones are combined into a “+N” tile.
Color is revenue growth y/y in the latest report: red — revenue fell, green — it grew (darker is stronger), light — roughly flat (±1%), hatched — no data.
Revenue: company filings with the SEC (XBRL) and our report cards. Tap a tile to open the report; if the ticker didn’t fit on the tile or there is no report yet, we show the name and numbers.
The latest reports of 22 companies in the sector at a glance. Fastest revenue growth: Eli Lilly and Company (+48%); slowest: Unitedhealth Group (+0.4%). Largest net income: Eli Lilly and Company. Full comparison below.
Latest earnings: Health Care compared
| Eli Lilly and Company | Q2 2026 | $22,974+48% | $7,095+25% | Aug 7, 2026 |
| Johnson & Johnson | Q2 2026 | $25,310+6.6% | $5,534-0.1% | Jul 15, 2026 |
| Abbvie | Q2 2026 | $16,990+10.2% | $3,616+284% | Jul 31, 2026 |
| Merck & Co. | Q2 2026 | $16,607+5.1% | — | Aug 4, 2026 |
| Unitedhealth Group | Q2 2026 | $112,032+0.4% | $5,484+61.0% | Jul 16, 2026 |
| Amgen | Q2 2026 | $10,054+9.5% | $2,375+65.9% | Aug 4, 2026 |
| Thermo Fisher Scientific | Q2 2026 | $11,994+10.5% | $1,736+7.4% | Jul 23, 2026 |
| Abbott Laboratories | Q2 2026 | $12,593+13.0% | $928−47.8% | Jul 16, 2026 |
| Gilead Sciences | Q2 2026 | $7,803+10.2% | — | Aug 4, 2026 |
| Pfizer | Q2 2026 | $15,034+3% | — | Aug 4, 2026 |
| Danaher | Q2 2026 | $6,265+5.5% | $870+56.8% | Jul 21, 2026 |
| Vertex Pharmaceuticals | Q2 2026 | $3,334+12.5% | $1,100+6.5% | Aug 3, 2026 |
| Bristol Myers Squibb | Q2 2026 | $12,973+5.7% | $3,317+153% | Jul 30, 2026 |
| Intuitive Surgical | Q2 2026 | $2,892+18.5% | $818+24.3% | Jul 16, 2026 |
| Stryker | Q2 2026 | $6,589+9.4% | $1,276+44.3% | Jul 30, 2026 |
| Cvs Health | Q2 2026 | $106,096+7.3% | $2,995+195.7% | Aug 5, 2026 |
| Medtronic | Q1 2027 | $9,756+13.7% | $1,470+41.4% | Sep 1, 2026 |
| Mckesson | Q1 FY2027 | $105,380+7.7% | $1,032+24.2% | Aug 5, 2026 |
| Hca Healthcare | Q2 2026 | $20,230+8.7% | $1,699+2.8% | Jul 24, 2026 |
| Elevance Health | Q2 2026 | $50,474+1.4% | — | Jul 15, 2026 |
| Regeneron Pharmaceuticals | Q2 2026 | $4,291+17% | $1,297−7% | Jul 30, 2026 |
| Cigna | Q2 2026 | $71,668+6.7% | $1,660+8.4% | Jul 30, 2026 |
Amounts in $ millions; changes vs the same period a year earlier. Figures come from our verified earnings breakdowns; fiscal periods differ between companies.
Other sectors
Information Technology 33.5% · Communication Services 15.7% · Financials 11.9% · Consumer Discretionary 9.3% · Industrials 7.9% · Consumer Staples 4.8% · Energy 3.1% · Utilities 1.8% · Materials 1.7% · Real Estate 1.7%