who reports todayUS earnings, drawn as flowsMy portfolio

← Who reports today

Consumer Staples

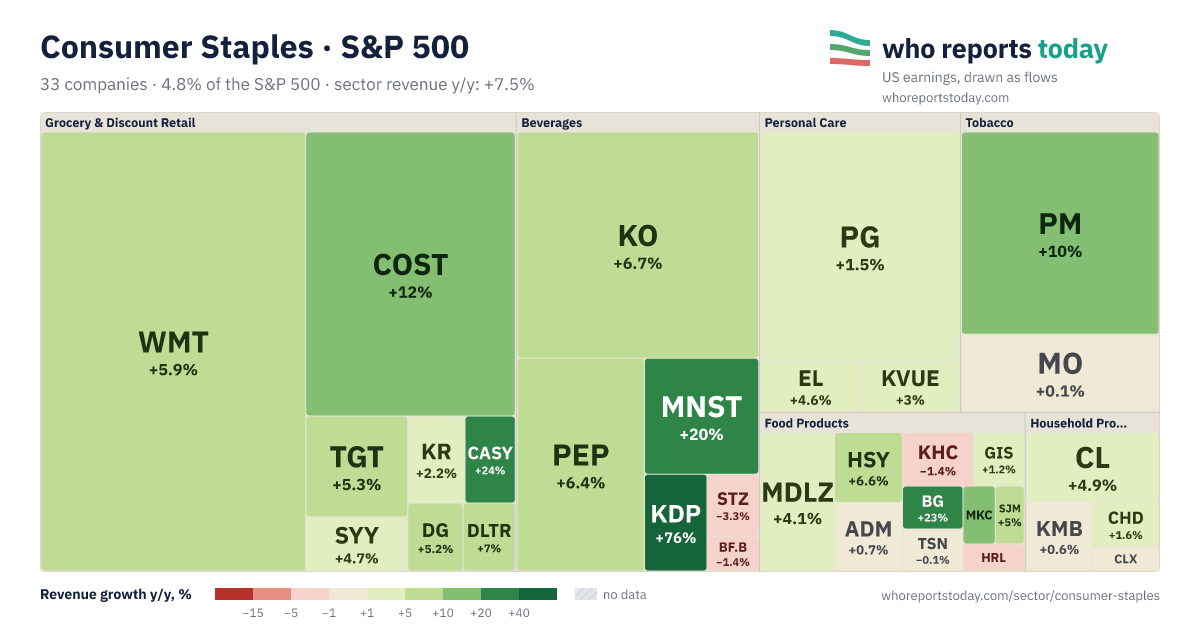
Share of the S&P 500 — 4.8% by market cap · 33 companies, sorted by weight. “deep dive →” marks a full earnings card.

Companies: index weight and revenue growth

Sector revenue growth y/y (weighted by index share): +7.5%

Grocery & Discount RetailWMT · Walmart — revenue y/y: +5.9% · quarter ended 07/31/2026; 23.7% of the sector · 1.13% of the indexWMT+5.9%COST · Costco Wholesale Corporation — revenue y/y: +12% · quarter ended 05/10/2026; 12.1% of the sector · 0.58% of the indexCOST+12%TGT · Target — revenue y/y: +5.3% · quarter ended 08/01/2026; 2.1% of the sector · 0.10% of the indexTGT+5.3%SYY · Sysco Corporation — revenue y/y: +4.7% · quarter ended 03/28/2026; 1.1% of the sector · 0.05% of the indexSYY+4.7%KR · The Kroger Co. — revenue y/y: +2.2% · quarter ended 05/23/2026; 1% of the sector · 0.05% of the indexKR+2.2%CASY · Casey's General Stores, Inc. — revenue y/y: +24% · quarter ended 07/31/2026; 0.9% of the sector · 0.04% of the indexCASY+24%DG · Dollar General Corporation — revenue y/y: +5.2% · quarter ended 07/31/2026; 0.8% of the sector · 0.04% of the indexDG+5.2%DLTR · Dollar Tree, Inc. — revenue y/y: +7% · quarter ended 08/01/2026; 0.7% of the sector · 0.03% of the indexDLTRBeveragesKO · Coca-Cola — revenue y/y: +6.7% · Q2 2026; 11.2% of the sector · 0.53% of the indexKO+6.7%PEP · Pepsico — revenue y/y: +6.4% · quarter ended 06/13/2026; 5.5% of the sector · 0.26% of the indexPEP+6.4%MNST · Monster Beverage — revenue y/y: +20% · quarter ended 06/30/2026; 2.7% of the sector · 0.13% of the indexMNST+20%KDP · Keurig Dr Pepper Inc. — revenue y/y: +76% · quarter ended 06/30/2026; 1.2% of the sector · 0.06% of the indexKDP+76%STZ · Constellation Brands, Inc. — revenue y/y: −3.3% · quarter ended 05/31/2026; 0.7% of the sector · 0.03% of the indexSTZ−3.3%BF.B · Brown-Forman Corporation — revenue y/y: −1.4% · quarter ended 07/31/2026; 0.4% of the sector · 0.02% of the indexBF.BPersonal CarePG · Procter & Gamble — revenue y/y: +1.5% · quarter ended 06/30/2026; 9.6% of the sector · 0.46% of the indexPG+1.5%EL · The Estée Lauder Companies Inc. — revenue y/y: +4.6% · quarter ended 03/31/2026; 1.1% of the sector · 0.05% of the indexEL+4.6%KVUE · Kenvue Inc. — revenue y/y: +3% · quarter ended 06/28/2026; 1.1% of the sector · 0.05% of the indexKVUE+3%TobaccoPM · Philip Morris International — revenue y/y: +10% · quarter ended 06/30/2026; 8.4% of the sector · 0.40% of the indexPM+10%MO · Altria Group — revenue y/y: +0.1% · quarter ended 06/30/2026; 3.2% of the sector · 0.15% of the indexMO+0.1%Food ProductsMDLZ · Mondelez International — revenue y/y: +4.1% · Q2 2026; 2.3% of the sector · 0.11% of the indexMDLZ+4.1%HSY · The Hershey Company — revenue y/y: +6.6% · quarter ended 06/28/2026; 1.1% of the sector · 0.05% of the indexHSY+6.6%ADM · Archer-Daniels-Midland Company — revenue y/y: +0.7% · quarter ended 06/30/2026; 1% of the sector · 0.05% of the indexADM+0.7%KHC · The Kraft Heinz Company — revenue y/y: −1.4% · quarter ended 06/27/2026; 0.9% of the sector · 0.04% of the indexKHC−1.4%GIS · General Mills, Inc. — revenue y/y: +1.2% · quarter ended 05/31/2026; 0.6% of the sector · 0.03% of the indexGIS+1.2%BG · Bunge Global SA — revenue y/y: +23% · quarter ended 06/30/2026; 0.6% of the sector · 0.03% of the indexBG+23%TSN · Tyson Foods, Inc. — revenue y/y: −0.1% · quarter ended 06/27/2026; 0.6% of the sector · 0.03% of the indexTSN−0.1%MKC · McCormick & Company, Incorporated — revenue y/y: +17% · quarter ended 05/31/2026; 0.4% of the sector · 0.02% of the indexMKCSJM · The J. M. Smucker Company — revenue y/y: +5% · quarter ended 07/31/2026; 0.4% of the sector · 0.02% of the indexSJM+5%HRL · Hormel Foods Corporation — revenue y/y: −2.4% · quarter ended 07/26/2026; 0.4% of the sector · 0.02% of the indexHRLHousehold Pro…CL · Colgate Palmolive — revenue y/y: +4.9% · quarter ended 06/30/2026; 2.1% of the sector · 0.10% of the indexCL+4.9%KMB · Kimberly-Clark Corporation — revenue y/y: +0.6% · quarter ended 06/30/2026; 1% of the sector · 0.05% of the indexKMB+0.6%CHD · Church & Dwight Co., Inc. — revenue y/y: +1.6% · quarter ended 06/30/2026; 0.7% of the sector · 0.03% of the indexCHD+1.6%CLX · The Clorox Company — revenue y/y: +0.1% · quarter ended 03/31/2026; 0.4% of the sector · 0.02% of the indexWMT · Walmart — revenue y/y: +5.9% · quarter ended 07/31/2026; 23.7% of the sector · 1.13% of the indexWMT+5.9%COST · Costco Wholesale Corporation — revenue y/y: +12% · quarter ended 05/10/2026; 12.1% of the sector · 0.58% of the indexCOST+12%KO · Coca-Cola — revenue y/y: +6.7% · Q2 2026; 11.2% of the sector · 0.53% of the indexKO+6.7%PG · Procter & Gamble — revenue y/y: +1.5% · quarter ended 06/30/2026; 9.6% of the sector · 0.46% of the indexPG+1.5%PM · Philip Morris International — revenue y/y: +10% · quarter ended 06/30/2026; 8.4% of the sector · 0.40% of the indexPM+10%PEP · Pepsico — revenue y/y: +6.4% · quarter ended 06/13/2026; 5.5% of the sector · 0.26% of the indexPEP+6.4%MO · Altria Group — revenue y/y: +0.1% · quarter ended 06/30/2026; 3.2% of the sector · 0.15% of the indexMO+0.1%MNST · Monster Beverage — revenue y/y: +20% · quarter ended 06/30/2026; 2.7% of the sector · 0.13% of the indexMNST+20%MDLZ · Mondelez International — revenue y/y: +4.1% · Q2 2026; 2.3% of the sector · 0.11% of the indexMDLZ+4.1%TGT · Target — revenue y/y: +5.3% · quarter ended 08/01/2026; 2.1% of the sector · 0.10% of the indexTGT+5.3%CL · Colgate Palmolive — revenue y/y: +4.9% · quarter ended 06/30/2026; 2.1% of the sector · 0.10% of the indexCL+4.9%KDP · Keurig Dr Pepper Inc. — revenue y/y: +76% · quarter ended 06/30/2026; 1.2% of the sector · 0.06% of the indexKDPSYY · Sysco Corporation — revenue y/y: +4.7% · quarter ended 03/28/2026; 1.1% of the sector · 0.05% of the indexSYYEL · The Estée Lauder Companies Inc. — revenue y/y: +4.6% · quarter ended 03/31/2026; 1.1% of the sector · 0.05% of the indexELHSY · The Hershey Company — revenue y/y: +6.6% · quarter ended 06/28/2026; 1.1% of the sector · 0.05% of the indexHSYKVUE · Kenvue Inc. — revenue y/y: +3% · quarter ended 06/28/2026; 1.1% of the sector · 0.05% of the indexADM · Archer-Daniels-Midland Company — revenue y/y: +0.7% · quarter ended 06/30/2026; 1% of the sector · 0.05% of the indexADMKMB · Kimberly-Clark Corporation — revenue y/y: +0.6% · quarter ended 06/30/2026; 1% of the sector · 0.05% of the indexKMBKR · The Kroger Co. — revenue y/y: +2.2% · quarter ended 05/23/2026; 1% of the sector · 0.05% of the indexKRCASY · Casey's General Stores, Inc. — revenue y/y: +24% · quarter ended 07/31/2026; 0.9% of the sector · 0.04% of the indexCASYKHC · The Kraft Heinz Company — revenue y/y: −1.4% · quarter ended 06/27/2026; 0.9% of the sector · 0.04% of the indexKHCDG · Dollar General Corporation — revenue y/y: +5.2% · quarter ended 07/31/2026; 0.8% of the sector · 0.04% of the indexDGDLTR · Dollar Tree, Inc. — revenue y/y: +7% · quarter ended 08/01/2026; 0.7% of the sector · 0.03% of the indexCHD · Church & Dwight Co., Inc. — revenue y/y: +1.6% · quarter ended 06/30/2026; 0.7% of the sector · 0.03% of the indexSTZ · Constellation Brands, Inc. — revenue y/y: −3.3% · quarter ended 05/31/2026; 0.7% of the sector · 0.03% of the indexSTZGIS · General Mills, Inc. — revenue y/y: +1.2% · quarter ended 05/31/2026; 0.6% of the sector · 0.03% of the indexGISBG · Bunge Global SA — revenue y/y: +23% · quarter ended 06/30/2026; 0.6% of the sector · 0.03% of the indexBGTSN · Tyson Foods, Inc. — revenue y/y: −0.1% · quarter ended 06/27/2026; 0.6% of the sector · 0.03% of the indexMKC · McCormick & Company, Incorporated — revenue y/y: +17% · quarter ended 05/31/2026; 0.4% of the sector · 0.02% of the indexSJM · The J. M. Smucker Company — revenue y/y: +5% · quarter ended 07/31/2026; 0.4% of the sector · 0.02% of the indexHRL · Hormel Foods Corporation — revenue y/y: −2.4% · quarter ended 07/26/2026; 0.4% of the sector · 0.02% of the indexBF.B · Brown-Forman Corporation — revenue y/y: −1.4% · quarter ended 07/31/2026; 0.4% of the sector · 0.02% of the indexCLX · The Clorox Company — revenue y/y: +0.1% · quarter ended 03/31/2026; 0.4% of the sector · 0.02% of the index
Color scale
Revenue growth y/y, %no data
As a list: all 33 companies
  1. WMT23.7%+5.9%
  2. COST12.1%+12%
  3. KO11.2%+6.7%
  4. PG9.6%+1.5%
  5. PM8.4%+10%
  6. PEP5.5%+6.4%
  7. MO3.2%+0.1%
  8. MNST2.7%+20%
  9. MDLZ2.3%+4.1%
  10. TGT2.1%+5.3%
  11. CL2.1%+4.9%
  12. KDP1.2%+76%
  13. SYY1.1%+4.7%
  14. EL1.1%+4.6%
  15. HSY1.1%+6.6%
  16. KVUE1.1%+3%
  17. ADM1%+0.7%
  18. KMB1%+0.6%
  19. KR1%+2.2%
  20. CASY0.9%+24%
  21. KHC0.9%−1.4%
  22. DG0.8%+5.2%
  23. DLTR0.7%+7%
  24. CHD0.7%+1.6%
  25. STZ0.7%−3.3%
  26. GIS0.6%+1.2%
  27. BG0.6%+23%
  28. TSN0.6%−0.1%
  29. MKC0.4%+17%
  30. SJM0.4%+5%
  31. HRL0.4%−2.4%
  32. BF.B0.4%−1.4%
  33. CLX0.4%+0.1%

Bar — the company’s share of the sector; right — revenue growth y/y.

How to read the map

Rectangle size is the company’s share of the S&P 500; together they make up the whole sector. On a wide screen companies are grouped by GICS industry, labelled above each group. The tiniest ones are combined into a “+N” tile.

Color is revenue growth y/y in the latest report: red — revenue fell, green — it grew (darker is stronger), light — roughly flat (±1%), hatched — no data.
Map as an image (PNG)

Revenue: company filings with the SEC (XBRL) and our report cards. Tap a tile to open the report; if the ticker didn’t fit on the tile or there is no report yet, we show the name and numbers.

The latest reports of 11 companies in the sector at a glance. Fastest revenue growth: Monster Beverage (+20.2%); slowest: Altria Group (+0.1%). Largest net income: Walmart. Full comparison below.

KDPKeurig Dr Pepper1.2% of sector · 0.06% of index
SYYSysco1.1% of sector · 0.05% of index
ELEstée Lauder Companies1.1% of sector · 0.05% of index
HSYHershey1.1% of sector · 0.05% of index
KVUEKenvue1.1% of sector · 0.05% of index
ADMArcher-Daniels-Midland1.0% of sector · 0.05% of index
KMBKimberly-Clark1.0% of sector · 0.05% of index
KRKroger1.0% of sector · 0.05% of index
CASYCasey's General Stores0.9% of sector · 0.04% of index
KHCKraft Heinz0.9% of sector · 0.04% of index
DGDollar General0.8% of sector · 0.04% of index
DLTRDollar Tree0.7% of sector · 0.03% of index
CHDChurch & Dwight0.7% of sector · 0.03% of index
STZConstellation Brands0.7% of sector · 0.03% of index
GISGeneral Mills0.6% of sector · 0.03% of index
BGBunge Global SA0.6% of sector · 0.03% of index
TSNTyson Foods0.6% of sector · 0.03% of index
MKCMcCormick0.4% of sector · 0.02% of index
SJMJ. M. Smucker0.4% of sector · 0.02% of index
HRLHormel Foods0.4% of sector · 0.02% of index
BF.BBrown-Forman0.4% of sector · 0.02% of index
CLXClorox0.4% of sector · 0.02% of index

Latest earnings: Consumer Staples compared

WalmartQ2 FY2027$187,937+5.9%$6,529−8.7%Aug 20, 2026
Costco WholesaleQ4 FY26$95,723+11.1%$2,998+14.9%Sep 24, 2026
Coca-ColaQ2 2026$13,380+6.7%$4,425+16.1%Jul 28, 2026
Procter & GambleQ4 2026$21,203+2%$3,081-15%Jul 29, 2026
Philip Morris InternationalQ2 2026$11,192+10.4%$2,817−7.3%Jul 22, 2026
PepsicoQ2 2026$24,181+6.4%$2,981+136%Jul 9, 2026
Altria GroupQ2 2026$6,111+0.1%$2,298−3.4%Jul 30, 2026
Monster BeverageQ2 2026$2,537+20.2%$585+19.6%Aug 6, 2026
Mondelez InternationalQ2 2026$9,355+4.1%$1,552+141%Jul 28, 2026
TargetQ2 2026$26,539+5.3%$1,877+100.8%Aug 19, 2026
Colgate PalmoliveQ2 2026$5,361+4.9%$719-7.0%Jul 31, 2026

Amounts in $ millions; changes vs the same period a year earlier. Figures come from our verified earnings breakdowns; fiscal periods differ between companies.

Other sectors

Information Technology 33.5% · Communication Services 15.7% · Financials 11.9% · Consumer Discretionary 9.3% · Health Care 8.8% · Industrials 7.9% · Energy 3.1% · Utilities 1.8% · Materials 1.7% · Real Estate 1.7%

We use cookies the site needs to work and, with your consent, Google Analytics for visit statistics. Details are in our privacy policy.