who reports todayUS earnings, drawn as flowsMy portfolio

← Who reports today

Energy

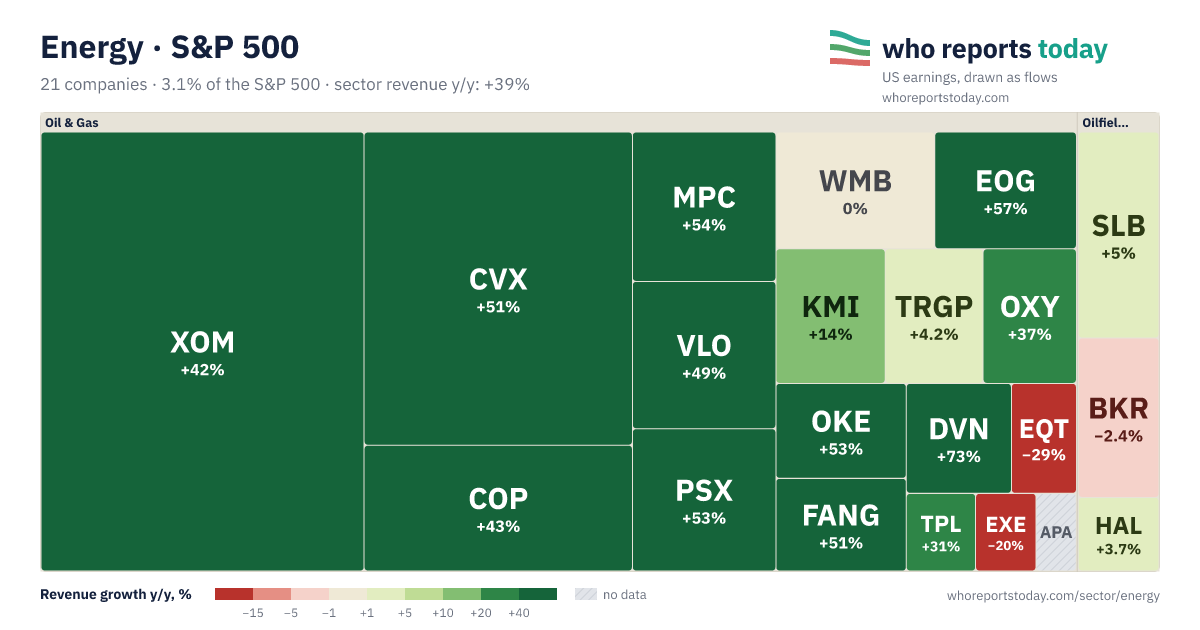
Share of the S&P 500 — 3.1% by market cap · 21 companies, sorted by weight. “deep dive →” marks a full earnings card.

Companies: index weight and revenue growth

Sector revenue growth y/y (weighted by index share): +39%

Oil & GasXOM · Exxonmobil Holdings — revenue y/y: +42% · quarter ended 06/30/2026; 28.9% of the sector · 0.90% of the indexXOM+42%CVX · Chevron — revenue y/y: +51% · quarter ended 06/30/2026; 17.1% of the sector · 0.53% of the indexCVX+51%COP · Conocophillips — revenue y/y: +43% · quarter ended 06/30/2026; 6.9% of the sector · 0.21% of the indexCOP+43%MPC · Marathon Petroleum — revenue y/y: +54% · quarter ended 06/30/2026; 4.4% of the sector · 0.14% of the indexMPC+54%VLO · Valero Energy — revenue y/y: +49% · Q2 2026; 4.3% of the sector · 0.13% of the indexVLO+49%PSX · Phillips 66 — revenue y/y: +53% · quarter ended 06/30/2026; 4.2% of the sector · 0.13% of the indexPSX+53%WMB · Williams Companies — revenue y/y: 0% · quarter ended 06/30/2026; 3.8% of the sector · 0.12% of the indexWMB0%EOG · EOG Resources, Inc. — revenue y/y: +57% · quarter ended 06/30/2026; 3.4% of the sector · 0.11% of the indexEOG+57%KMI · Kinder Morgan, Inc. — revenue y/y: +14% · quarter ended 06/30/2026; 3% of the sector · 0.09% of the indexKMI+14%TRGP · Targa Resources Corp. — revenue y/y: +4.2% · quarter ended 06/30/2026; 2.7% of the sector · 0.08% of the indexTRGP+4.2%OXY · Occidental Petroleum Corporation — revenue y/y: +37% · quarter ended 06/30/2026; 2.6% of the sector · 0.08% of the indexOXY+37%OKE · ONEOK, Inc. — revenue y/y: +53% · quarter ended 06/30/2026; 2.5% of the sector · 0.08% of the indexOKE+53%FANG · Diamondback Energy, Inc. — revenue y/y: +51% · quarter ended 06/30/2026; 2.5% of the sector · 0.08% of the indexFANG+51%DVN · Devon Energy Corporation — revenue y/y: +73% · quarter ended 06/30/2026; 2.4% of the sector · 0.07% of the indexDVN+73%EQT · EQT Corporation — revenue y/y: −29% · quarter ended 06/30/2026; 1.5% of the sector · 0.05% of the indexEQT−29%TPL · Texas Pacific Land Corporation — revenue y/y: +31% · quarter ended 06/30/2026; 1.1% of the sector · 0.03% of the indexTPL+31%EXE · Expand Energy Corporation — revenue y/y: −20% · quarter ended 06/30/2026; 1% of the sector · 0.03% of the indexEXE−20%APA · APA Corporation — revenue y/y: no data; 0.6% of the sector · 0.02% of the indexAPAOilfiel…SLB · SLB — revenue y/y: +5% · quarter ended 06/30/2026; 3.5% of the sector · 0.11% of the indexSLB+5%BKR · Baker Hughes Company — revenue y/y: −2.4% · quarter ended 06/30/2026; 2.7% of the sector · 0.08% of the indexBKR−2.4%HAL · Halliburton Company — revenue y/y: +3.7% · quarter ended 06/30/2026; 1.2% of the sector · 0.04% of the indexHAL+3.7%XOM · Exxonmobil Holdings — revenue y/y: +42% · quarter ended 06/30/2026; 28.9% of the sector · 0.90% of the indexXOM+42%CVX · Chevron — revenue y/y: +51% · quarter ended 06/30/2026; 17.1% of the sector · 0.53% of the indexCVX+51%COP · Conocophillips — revenue y/y: +43% · quarter ended 06/30/2026; 6.9% of the sector · 0.21% of the indexCOP+43%MPC · Marathon Petroleum — revenue y/y: +54% · quarter ended 06/30/2026; 4.4% of the sector · 0.14% of the indexMPC+54%VLO · Valero Energy — revenue y/y: +49% · Q2 2026; 4.3% of the sector · 0.13% of the indexVLO+49%PSX · Phillips 66 — revenue y/y: +53% · quarter ended 06/30/2026; 4.2% of the sector · 0.13% of the indexPSX+53%WMB · Williams Companies — revenue y/y: 0% · quarter ended 06/30/2026; 3.8% of the sector · 0.12% of the indexWMB0%SLB · SLB — revenue y/y: +5% · quarter ended 06/30/2026; 3.5% of the sector · 0.11% of the indexSLB+5%EOG · EOG Resources, Inc. — revenue y/y: +57% · quarter ended 06/30/2026; 3.4% of the sector · 0.11% of the indexEOG+57%KMI · Kinder Morgan, Inc. — revenue y/y: +14% · quarter ended 06/30/2026; 3% of the sector · 0.09% of the indexKMI+14%TRGP · Targa Resources Corp. — revenue y/y: +4.2% · quarter ended 06/30/2026; 2.7% of the sector · 0.08% of the indexTRGP+4.2%BKR · Baker Hughes Company — revenue y/y: −2.4% · quarter ended 06/30/2026; 2.7% of the sector · 0.08% of the indexBKR−2.4%OXY · Occidental Petroleum Corporation — revenue y/y: +37% · quarter ended 06/30/2026; 2.6% of the sector · 0.08% of the indexOXY+37%OKE · ONEOK, Inc. — revenue y/y: +53% · quarter ended 06/30/2026; 2.5% of the sector · 0.08% of the indexOKE+53%FANG · Diamondback Energy, Inc. — revenue y/y: +51% · quarter ended 06/30/2026; 2.5% of the sector · 0.08% of the indexFANG+51%DVN · Devon Energy Corporation — revenue y/y: +73% · quarter ended 06/30/2026; 2.4% of the sector · 0.07% of the indexDVN+73%EQT · EQT Corporation — revenue y/y: −29% · quarter ended 06/30/2026; 1.5% of the sector · 0.05% of the indexEQTHAL · Halliburton Company — revenue y/y: +3.7% · quarter ended 06/30/2026; 1.2% of the sector · 0.04% of the indexHALTPL · Texas Pacific Land Corporation — revenue y/y: +31% · quarter ended 06/30/2026; 1.1% of the sector · 0.03% of the indexEXE · Expand Energy Corporation — revenue y/y: −20% · quarter ended 06/30/2026; 1% of the sector · 0.03% of the indexEXEAPA · APA Corporation — revenue y/y: no data; 0.6% of the sector · 0.02% of the index
Color scale
Revenue growth y/y, %no data
As a list: all 21 companies
  1. XOM28.9%+42%
  2. CVX17.1%+51%
  3. COP6.9%+43%
  4. MPC4.4%+54%
  5. VLO4.3%+49%
  6. PSX4.2%+53%
  7. WMB3.8%0%
  8. SLB3.5%+5%
  9. EOG3.4%+57%
  10. KMI3%+14%
  11. TRGP2.7%+4.2%
  12. BKR2.7%−2.4%
  13. OXY2.6%+37%
  14. OKE2.5%+53%
  15. FANG2.5%+51%
  16. DVN2.4%+73%
  17. EQT1.5%−29%
  18. HAL1.2%+3.7%
  19. TPL1.1%+31%
  20. EXE1%−20%
  21. APA0.6%—

Bar — the company’s share of the sector; right — revenue growth y/y.

How to read the map

Rectangle size is the company’s share of the S&P 500; together they make up the whole sector. On a wide screen companies are grouped by GICS industry, labelled above each group. The tiniest ones are combined into a “+N” tile.

Color is revenue growth y/y in the latest report: red — revenue fell, green — it grew (darker is stronger), light — roughly flat (±1%), hatched — no data.
Map as an image (PNG)

Revenue: company filings with the SEC (XBRL) and our report cards. Tap a tile to open the report; if the ticker didn’t fit on the tile or there is no report yet, we show the name and numbers.

The latest reports of 9 companies in the sector at a glance. Fastest revenue growth: EOG Resources (+57.4%); slowest: SLB (+5.0%). Largest net income: Exxonmobil Holdings. Full comparison below.

KMIKinder Morgan3.0% of sector · 0.09% of index
TRGPTarga Resources2.7% of sector · 0.08% of index
BKRBaker Hughes2.7% of sector · 0.08% of index
OXYOccidental Petroleum2.6% of sector · 0.08% of index
OKEONEOK2.5% of sector · 0.08% of index
FANGDiamondback Energy2.5% of sector · 0.08% of index
DVNDevon Energy2.4% of sector · 0.07% of index
EQTEQT1.5% of sector · 0.05% of index
HALHalliburton1.2% of sector · 0.04% of index
TPLTexas Pacific Land1.1% of sector · 0.03% of index
EXEExpand Energy1.0% of sector · 0.03% of index
APAAPA0.6% of sector · 0.02% of index

Latest earnings: Energy compared

Exxonmobil HoldingsQ2 2026—$14,525+105.1%Jul 31, 2026
ChevronQ2 2026$70,055+56.3%$12,072+384.8%Jul 31, 2026
ConocophillipsQ2 2026$19,161+36.8%$3,931+99.4%Aug 6, 2026
Marathon PetroleumQ2 2026$52,337+53%$5,538+244%Aug 4, 2026
Valero EnergyQ2 2026$44,476+48.8%$4,073Jul 30, 2026
Phillips 66Q2 2026—$3,847+338%Aug 5, 2026
Williams CompaniesQ2 2026$3,053+9.8%$876+50%Aug 3, 2026
SLBQ2 2026$8,972+5.0%$786−22.5%Jul 24, 2026
EOG ResourcesQ2 2026$8,620+57.4%$2,724+102.5%Aug 4, 2026

Amounts in $ millions; changes vs the same period a year earlier. Figures come from our verified earnings breakdowns; fiscal periods differ between companies.

Other sectors

Information Technology 33.5% · Communication Services 15.7% · Financials 11.9% · Consumer Discretionary 9.3% · Health Care 8.8% · Industrials 7.9% · Consumer Staples 4.8% · Utilities 1.8% · Materials 1.7% · Real Estate 1.7%

We use cookies the site needs to work and, with your consent, Google Analytics for visit statistics. Details are in our privacy policy.