Information Technology
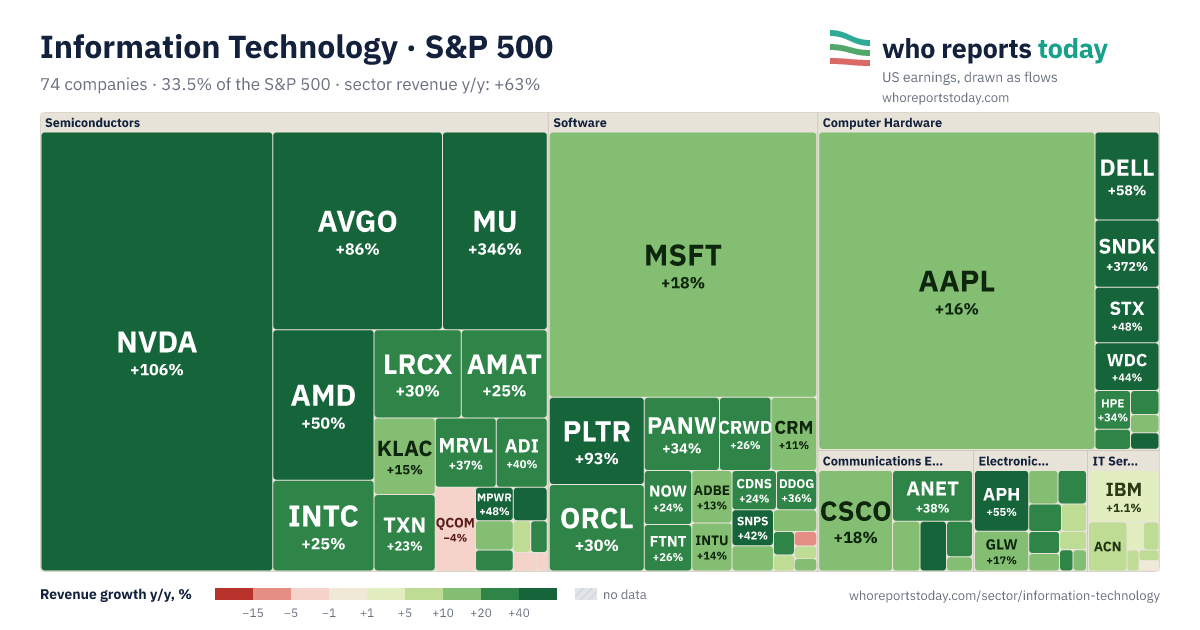
Share of the S&P 500 — 33.5% by market cap · 74 companies, sorted by weight. “deep dive →” marks a full earnings card.
Companies: index weight and revenue growth
Sector revenue growth y/y (weighted by index share): +63%
Color scale
How to read the map
Rectangle size is the company’s share of the S&P 500; together they make up the whole sector. On a wide screen companies are grouped by GICS industry, labelled above each group. The tiniest ones are combined into a “+N” tile.
Color is revenue growth y/y in the latest report: red — revenue fell, green — it grew (darker is stronger), light — roughly flat (±1%), hatched — no data.
Revenue: company filings with the SEC (XBRL) and our report cards. Tap a tile to open the report; if the ticker didn’t fit on the tile or there is no report yet, we show the name and numbers.
The latest reports of 37 companies in the sector at a glance. Fastest revenue growth: Micron Technology (+379%); slowest: Qualcomm (−4.0%). Largest net income: Nvidia. Full comparison below.
Latest earnings: Information Technology compared
| Nvidia | Q2 FY2027 | $96,221+106% | $59,688+126% | Aug 26, 2026 |
| Apple | Q3 2026 | $109,417+16.4% | $29,789+27.1% | Jul 30, 2026 |
| Microsoft | Q4 FY2026 | $90,007+18% | $35,766+31% | Jul 29, 2026 |
| Broadcom | Q3 FY2026 | $29,591+86% | $13,088+216% | Sep 2, 2026 |
| Micron Technology | Q4 FY2026 | $54,229+379% | $37,701+1078% | Sep 30, 2026 |
| Advanced Micro Devices | Q2 2026 | $11,536+50.1% | $2,297+163.4% | Aug 4, 2026 |
| Intel | Q2 2026 | $16,128+25.4% | — | Jul 24, 2026 |
| Cisco Systems | Q4 2026 | $17,252+18% | $3,859+51.3% | Aug 12, 2026 |
| Palantir Technologies | Q2 2026 | $1,935+93% | $1,062+225% | Aug 3, 2026 |
| Oracle | Q1 FY2027 | $19,345+30% | $4,760+63% | Sep 10, 2026 |
| Lam Research | Q4 2026 | $6,722+30.0% | $2,277+32.4% | Jul 29, 2026 |
| Applied Materials | Q3 2026 | $9,115+24.8% | $2,538+42.7% | Aug 13, 2026 |
| Dell Technologies | Q2 FY2027 | $46,971+58% | $4,133+255% | Sep 1, 2026 |
| Palo Alto Networks | Q4 FY2026 | $3,410+34.5% | — | Sep 1, 2026 |
| Arista Networks | Q2 2026 | $3,036+37.7% | $1,213+36.5% | Aug 4, 2026 |
| KLA | Q4 FY2026 | $3,658+15.2% | $1,363+13.3% | Jul 28, 2026 |
| Texas Instruments | Q2 2026 | $5,463+23% | $1,980+53% | Jul 22, 2026 |
| Sandisk | Q4 2026 | $8,965+372% | $6,903 | Aug 5, 2026 |
| International Business Machines | Q2 2026 | $17,162+1.1% | $2,165−1.3% | Jul 22, 2026 |
| Marvell Technology | Q2 FY2027 | $2,739.3+37% | $308.0+58.1% | Aug 27, 2026 |
| Amphenol | Q2 2026 | $8,758+55.0% | $1,784+62.1% | Jul 29, 2026 |
| Crowdstrike Holdings | Q2 FY2027 | $1,470.9+25.8% | $5.3 | Aug 26, 2026 |
| Seagate Technology Holdings | FQ4 2026 | $3,629+48.5% | $1,294+165% | Jul 29, 2026 |
| Analog Devices | Q3 2026 | $4,022+40% | $1,340+158% | Aug 19, 2026 |
| Qualcomm | Q3 FY2026 | $9,947−4.0% | $2,002−24.9% | Jul 29, 2026 |
| Salesforce | Q2 FY2027 | $11,345+10.8% | $3,526+86.9% | Aug 26, 2026 |
| Western Digital | Q4 2026 | $3,747+44% | $3,195+1033% | Aug 5, 2026 |
| Servicenow | Q2 2026 | $3,987+24% | $298−23% | Jul 22, 2026 |
| Corning | Q2 2026 | $4,505+17% | $559+19% | Jul 28, 2026 |
| Accenture | Q4 FY2026 | $18,679+6.2% | $1,991+40.8% | Oct 1, 2026 |
| Fortinet | Q2 2026 | $2,048+25.6% | $606+37.8% | Jul 29, 2026 |
| Adobe | Q3 2026 | $6,760+12.9% | $1,827+3.1% | Sep 10, 2026 |
| Intuit | Q4 FY2026 | $4,354+13.7% | $363−4.7% | Aug 25, 2026 |
| Cadence Design Systems | Q2 2026 | $1,584+24.2% | $367+129.4% | Jul 27, 2026 |
| Datadog | Q2 2026 | $1,121+35.6% | $45 | Aug 6, 2026 |
| Motorola Solutions | Q2 2026 | $3,133+13.3% | $557+8.6% | Aug 5, 2026 |
| Synopsys | Q3 FY26 | $2,477+42.4% | $546+125% | Aug 26, 2026 |
Amounts in $ millions; changes vs the same period a year earlier. Figures come from our verified earnings breakdowns; fiscal periods differ between companies.
Other sectors
Communication Services 15.7% · Financials 11.9% · Consumer Discretionary 9.3% · Health Care 8.8% · Industrials 7.9% · Consumer Staples 4.8% · Energy 3.1% · Utilities 1.8% · Materials 1.7% · Real Estate 1.7%