← Who reports today · Consumer Discretionary
GM · Q2 2026
Archived report (Q2 2026). Latest deep dive →
The quarter in brief
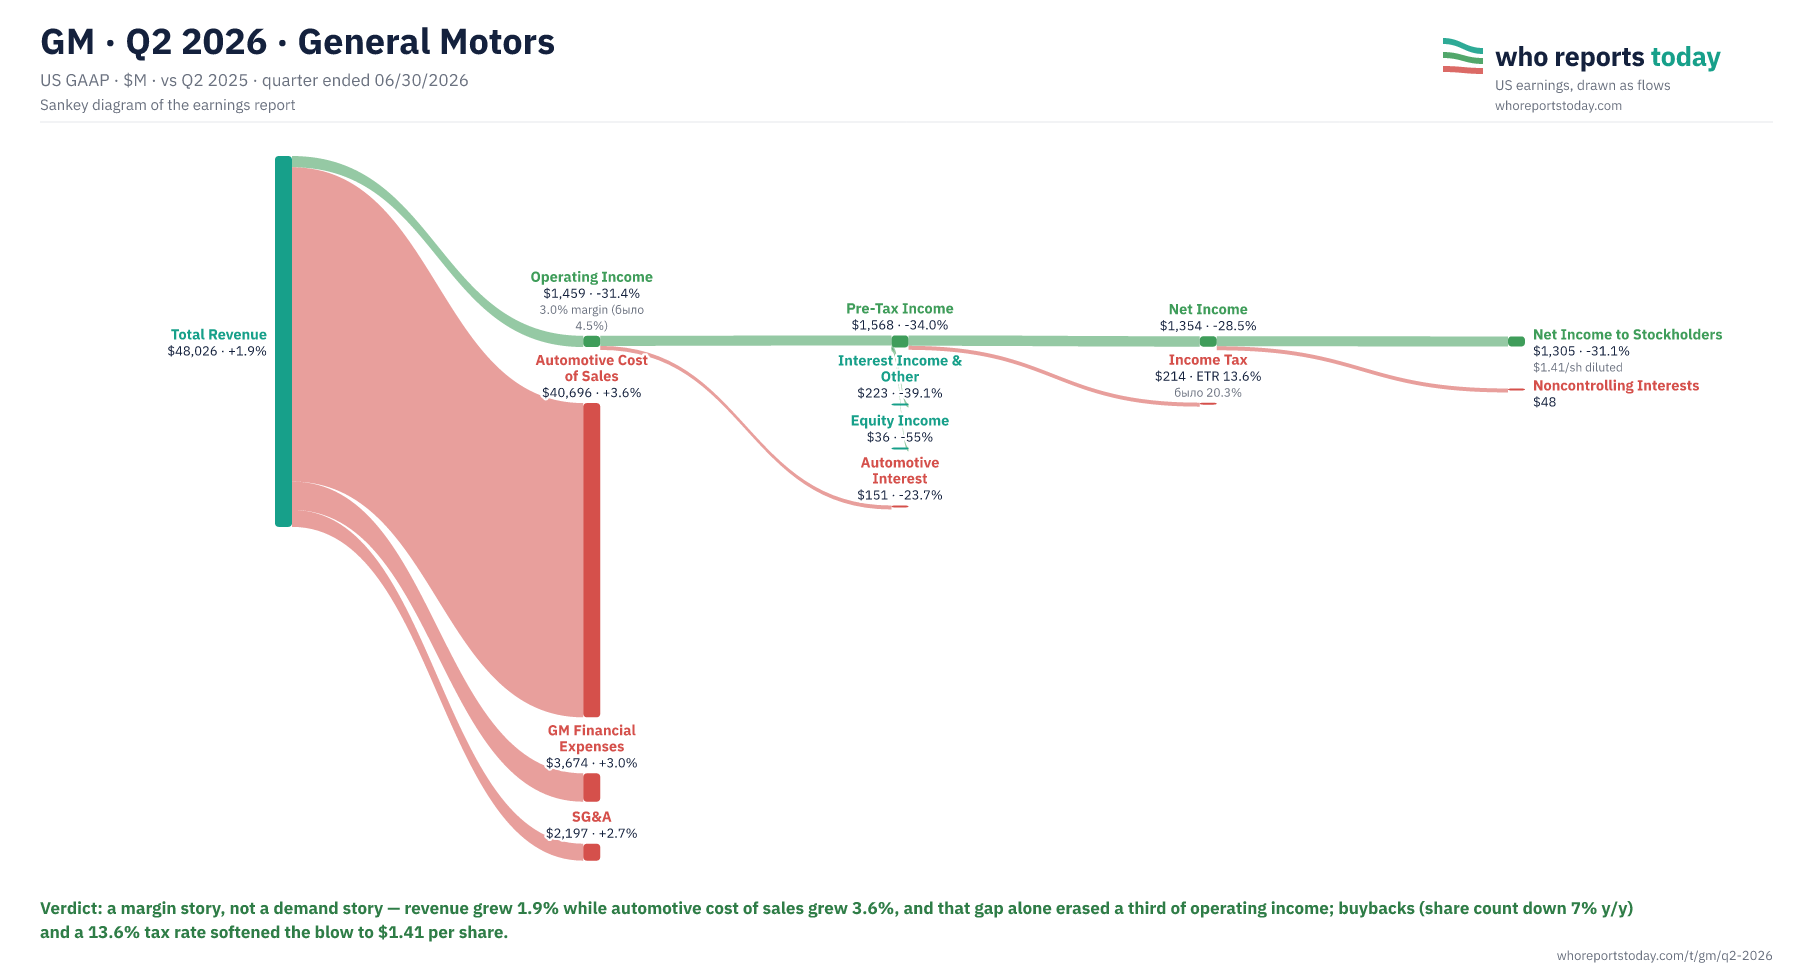
A margin story, not a demand story — revenue grew 1.9% while automotive cost of sales grew 3.6%, and that gap alone erased a third of operating income; buybacks (share count down 7% y/y) and a 13.6% tax rate softened the blow to $1.41 per share.
Net Income
$1,354M
down 28.5% y/y
Total Revenue
$48,026M
up 1.9% y/y
Operating Income
$1,459M
down 31.4% y/y
All figures in $M.
| Line item | Amount and change |
|---|---|
| Total Revenue | $48,026 · +1.9% |
| Automotive Cost of Sales | $40,696 · +3.6% |
| GM Financial Expenses | $3,674 · +3.0% |
| SG&A | $2,197 · +2.7% |
| Operating Income | $1,459 · -31.4% · 3.0% margin (было 4.5%) |
| Interest Income & Other | $223 · -39.1% |
| Equity Income | $36 · -55% |
| Automotive Interest | $151 · -23.7% |
| Pre-Tax Income | $1,568 · -34.0% |
| Income Tax | $214 · ETR 13.6% · было 20.3% |
| Net Income | $1,354 · -28.5% |
| Noncontrolling Interests | $48 |
| Net Income to Stockholders | $1,305 · -31.1% · $1.41/sh diluted |
Verdict: a margin story, not a demand story — revenue grew 1.9% while automotive cost of sales grew 3.6%, and that gap alone erased a third of operating income; buybacks (share count down 7% y/y) and a 13.6% tax rate softened the blow to $1.41 per share.
Diluted EPS $1.41 (−26.2%). Basic share count fell from 963M to 896M year over year. GM Financial runs as a separate cost block: $3,674M of interest and operating expenses.
Source and notation
* marks non-cash / ≈ estimated. Preferred dividends ($18M) sit between net income to stockholders and to common. Source: General Motors 10-Q (SEC EDGAR).
Cite / embed this chart
Free to use in articles, research and social posts with credit to Who Reports Today and a link — licensed under CC BY 4.0 (terms).
Chart: “GM Q2 2026: where the revenue went” by Who Reports Today, https://whoreportstoday.com/t/gm/q2-2026. Licensed under CC BY 4.0.
<figure>
  <a href="https://whoreportstoday.com/t/gm/q2-2026"><img src="https://whoreportstoday.com/t/gm/q2-2026/sankey.png" alt="GM Q2 2026: where the revenue went" loading="lazy" style="max-width:100%;height:auto"></a>
  <figcaption>Source: <a href="https://whoreportstoday.com/t/gm/q2-2026">Who Reports Today</a>, licensed under <a href="https://creativecommons.org/licenses/by/4.0/">CC BY 4.0</a></figcaption>
</figure>
https://whoreportstoday.com/t/gm/q2-2026/sankey.png
<a href="https://whoreportstoday.com/t/gm/q2-2026">GM Q2 2026 earnings chart (Who Reports Today)</a>
This is an archived report: the image at this link won’t change. If you change the chart (crop, translate), say so in the credit. Company logos and trademarks are not covered by the license.
- The entire profit decline fits in one line: automotive cost of sales rose 3.6% to $40,696M against 1.9% revenue growth — on a business this thin, that gap costs a third of operating income.
- Operating margin compressed to 3.0% from 4.5% — normal for a carmaker in a cost squeeze, but it leaves little room for error.
- SG&A was disciplined (+2.7%), so the pressure is in materials, freight, manufacturing and warranty, not in overhead.
- GM Financial is effectively a bank inside the carmaker: $3,674M of interest and operating expenses flow through the same P&L.
- Tax rate dropped to 13.6% from 20.3% — without it, net income would have fallen closer to 40%.
- Buybacks are doing heavy lifting: basic share count fell 7% y/y (963M → 896M), so EPS fell 26% while net income fell 31%.
- Interest income and other halved to $223M from $366M, and equity income from affiliates dropped to $36M from $80M — both tailwinds faded at once.
- Leased EVs now account for 22.9% of total residual values (21.1% at the end of 2025) — the residual-risk exposure keeps growing.
What distorts the picture in this report and what to watch beyond the headlines.
GM — General Motors designs, manufactures, and sells vehicles and vehicle parts under brands such as Chevrolet, GMC, Cadillac, and Buick.
The company is headquartered in Detroit, Michigan.
Heads-up
- net income fell 28% y/y in Q2 2026
Most likely because SG&A was disciplined (+2.7%), so the pressure is in materials, freight, manufacturing and warranty, not in overhead; the entire profit decline fits in one line: automotive cost of sales rose 3.6% to $40,696M against 1.9% revenue growth. Based on the Q2 2026 report.
Company filings on SEC EDGAR ↗More reports: GPC · Q3 2026 · GRMN · Q2 2026 · HAS · Q3 2026 · HD · Q2 FY2026 · HLT · Q2 2026 · LEN · Q3 FY2026 · LOW · Q2 2026 · LULU · Q2 FY2026 · LVS · Q2 2026 · MAR · Q2 2026 · all reports