← Who reports today · Consumer Discretionary
GPC · Q2 2026
Archived report (Q2 2026). Latest deep dive →
The quarter in brief
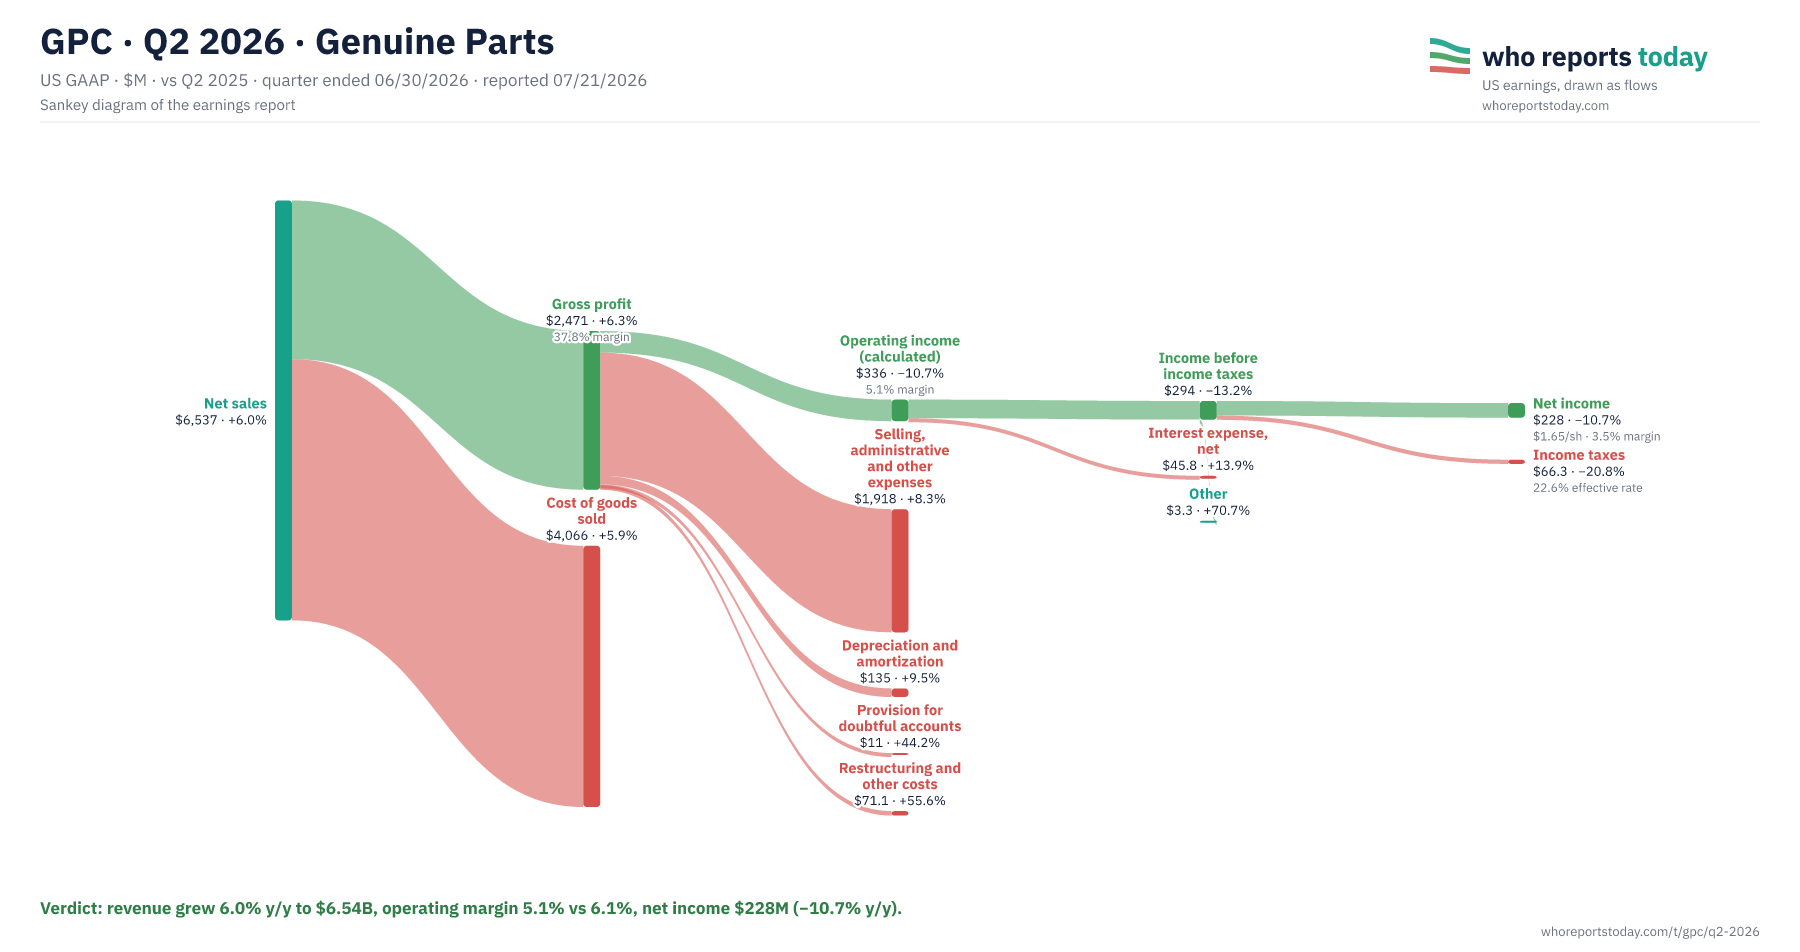
Revenue grew 6.0% y/y to $6.54B, operating margin 5.1% vs 6.1%, net income $228M (−10.7% y/y).
Net income
$228M
down 10.7% y/y
Net sales
$6,537M
up 6.0% y/y
Operating income (calculated)
$336M
down 10.7% y/y
Gross profit
$2,471M
up 6.3% y/y
All figures in $M.
| Line item | Amount and change |
|---|---|
| Net sales | $6,537 · +6.0% |
| Cost of goods sold | $4,066 · +5.9% |
| Gross profit | $2,471 · +6.3% · 37.8% margin |
| Selling, administrative and other expenses | $1,918 · +8.3% |
| Depreciation and amortization | $135 · +9.5% |
| Provision for doubtful accounts | $11 · +44.2% |
| Restructuring and other costs | $71.1 · +55.6% |
| Operating income (calculated) | $336 · −10.7% · 5.1% margin |
| Interest expense, net | $45.8 · +13.9% |
| Other | $3.3 · +70.7% |
| Income before income taxes | $294 · −13.2% |
| Income taxes | $66.3 · −20.8% · 22.6% effective rate |
| Net income | $228 · −10.7% · $1.65/sh · 3.5% margin |
Verdict: revenue grew 6.0% y/y to $6.54B, operating margin 5.1% vs 6.1%, net income $228M (−10.7% y/y).
Source and notation
Source: Genuine Parts press release, 8-K EX-99.1 of 07/21/2026 (SEC EDGAR). Every figure was matched against the income statement in the release and checked against SEC XBRL. Operating income is calculated (revenue less costs and operating expenses): the release does not report it.
Cite / embed this chart
Free to use in articles, research and social posts with credit to Who Reports Today and a link — licensed under CC BY 4.0 (terms).
Chart: “GPC Q2 2026: where the revenue went” by Who Reports Today, https://whoreportstoday.com/t/gpc/q2-2026. Licensed under CC BY 4.0.
<figure>
  <a href="https://whoreportstoday.com/t/gpc/q2-2026"><img src="https://whoreportstoday.com/t/gpc/q2-2026/sankey.png" alt="GPC Q2 2026: where the revenue went" loading="lazy" style="max-width:100%;height:auto"></a>
  <figcaption>Source: <a href="https://whoreportstoday.com/t/gpc/q2-2026">Who Reports Today</a>, licensed under <a href="https://creativecommons.org/licenses/by/4.0/">CC BY 4.0</a></figcaption>
</figure>
https://whoreportstoday.com/t/gpc/q2-2026/sankey.png
<a href="https://whoreportstoday.com/t/gpc/q2-2026">GPC Q2 2026 earnings chart (Who Reports Today)</a>
This is an archived report: the image at this link won’t change. If you change the chart (crop, translate), say so in the credit. Company logos and trademarks are not covered by the license.
- Gross margin was 37.8% vs 37.7% a year earlier.
- Operating income was $336M, a 5.1% margin vs 6.1% a year earlier.
- The effective tax rate was 22.6% vs 24.7% a year earlier.
- Diluted EPS was $1.65 vs $1.83 a year earlier.
What distorts the picture in this report and what to watch beyond the headlines.
Heads-up
- net income fell 11% y/y in Q2 2026
Most likely because gross margin was 37.8% vs 37.7% a year earlier; the effective tax rate was 22.6% vs 24.7% a year earlier; costs grew faster than revenue (restructuring and other costs +56% y/y, interest expense, net +14% y/y, provision for doubtful accounts +44% y/y). Based on the Q2 2026 report.
The company's report ↗More reports: GRMN · Q2 2026 · HAS · Q3 2026 · HD · Q2 FY2026 · HLT · Q2 2026 · LEN · Q3 FY2026 · LOW · Q2 2026 · LULU · Q2 FY2026 · LVS · Q2 2026 · MAR · Q2 2026 · MCD · Q2 2026 · all reports