← Who reports today · Communication Services
NFLX · Q2 2026
Archived report (Q2 2026). Latest deep dive →
The quarter in brief
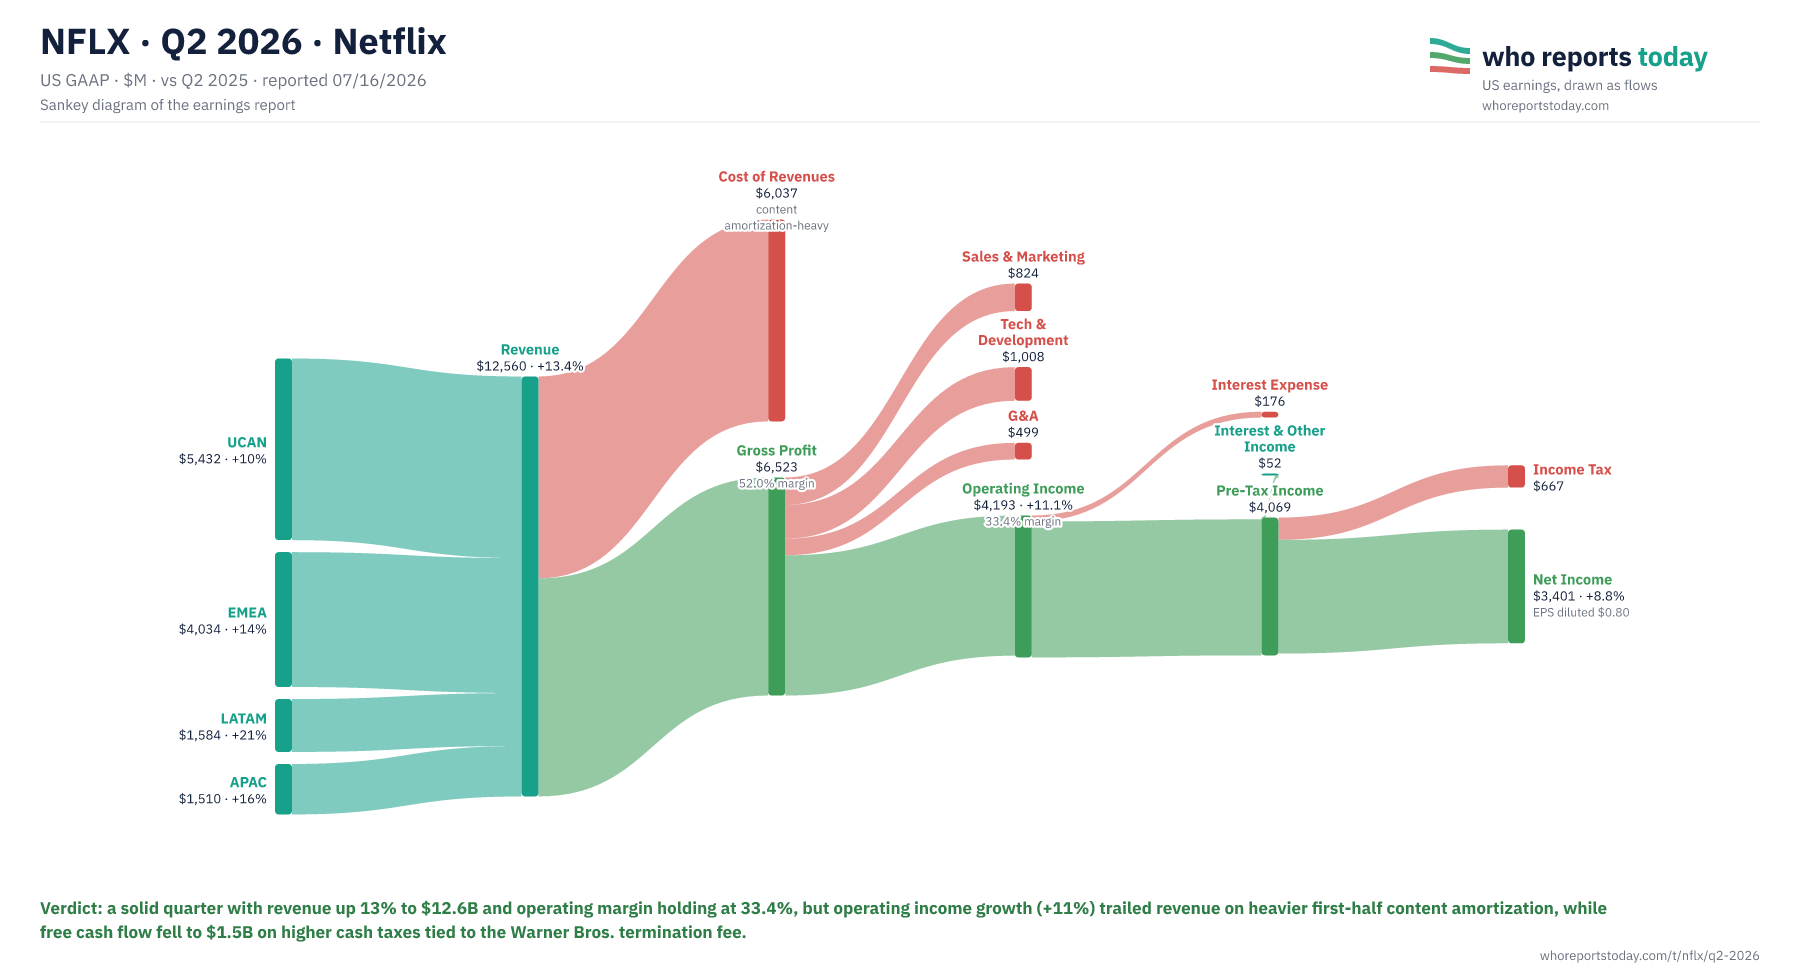
A solid quarter with revenue up 13% to $12.6B and operating margin holding at 33.4%, but operating income growth (+11%) trailed revenue on heavier first-half content amortization, while free cash flow fell to $1.5B on higher cash taxes tied to the Warner Bros. termination fee.
Net Income
$3,401M
up 8.8% y/y
Revenue
$12,560M
up 13.4% y/y
Operating Income
$4,193M
up 11.1% y/y
Gross Profit
$6,523M
All figures in $M.
| Line item | Amount and change |
|---|---|
| UCAN | $5,432 · +10% |
| EMEA | $4,034 · +14% |
| LATAM | $1,584 · +21% |
| APAC | $1,510 · +16% |
| Revenue | $12,560 · +13.4% |
| Cost of Revenues | $6,037 · content amortization-heavy |
| Gross Profit | $6,523 · 52.0% margin |
| Sales & Marketing | $824 |
| Tech & Development | $1,008 |
| G&A | $499 |
| Operating Income | $4,193 · +11.1% · 33.4% margin |
| Interest Expense | $176 |
| Interest & Other Income | $52 |
| Pre-Tax Income | $4,069 |
| Income Tax | $667 |
| Net Income | $3,401 · +8.8% · EPS diluted $0.80 |
Verdict: a solid quarter with revenue up 13% to $12.6B and operating margin holding at 33.4%, but operating income growth (+11%) trailed revenue on heavier first-half content amortization, while free cash flow fell to $1.5B on higher cash taxes tied to the Warner Bros. termination fee.
OCF $1,744M · FCF $1,525M vs $2,267M Q2'25 · $4.7B buyback in Q2 (largest ever, $27.1B capacity left) · FY26 guide: revenue $51.0-51.4B, op margin 31.5%, FCF ≈$12.5B
Source and notation
* marks non-cash / ≈ estimated. Source: Netflix shareholder letter / press release (SEC EDGAR).
Cite / embed this chart
Free to use in articles, research and social posts with credit to Who Reports Today and a link — licensed under CC BY 4.0 (terms).
Chart: “NFLX Q2 2026: where the revenue went” by Who Reports Today, https://whoreportstoday.com/t/nflx/q2-2026. Licensed under CC BY 4.0.
<figure>
  <a href="https://whoreportstoday.com/t/nflx/q2-2026"><img src="https://whoreportstoday.com/t/nflx/q2-2026/sankey.png" alt="NFLX Q2 2026: where the revenue went" loading="lazy" style="max-width:100%;height:auto"></a>
  <figcaption>Source: <a href="https://whoreportstoday.com/t/nflx/q2-2026">Who Reports Today</a>, licensed under <a href="https://creativecommons.org/licenses/by/4.0/">CC BY 4.0</a></figcaption>
</figure>
https://whoreportstoday.com/t/nflx/q2-2026/sankey.png
<a href="https://whoreportstoday.com/t/nflx/q2-2026">NFLX Q2 2026 earnings chart (Who Reports Today)</a>
This is an archived report: the image at this link won’t change. If you change the chart (crop, translate), say so in the credit. Company logos and trademarks are not covered by the license.
- Revenue growth of 13% (12% FX-neutral) was driven by membership growth, pricing, and ad revenue, with double-digit growth in all four regions.
- Operating margin was 33.4% vs 34.1% a year ago; op income grew slower than revenue because content amortization growth is front-loaded in H1'26, expected to ease in H2.
- Q1'26 had a one-time $2.85B 'interest and other income' gain (not present in Q2), so sequential net income comparisons are distorted; Q2'26 net income of $3,401M is a clean GAAP figure.
- FCF of $1.5B (vs $2.3B Q2'25) partly reflects higher cash tax payments related to the Warner Bros. termination fee, a one-off cash item not in GAAP net income.
- UCAN growth slowed to 10% y/y reflecting only partial-quarter impact of recent US price change; LATAM and APAC both crossed $1.5B in quarterly revenue for the first time.
- Company reiterated FY26 outlook (revenue $51.0-51.4B, op margin 31.5%, ads revenue ~$3B, roughly doubling) and repurchased a record $4.7B of stock in the quarter.
What distorts the picture in this report and what to watch beyond the headlines.
NFLX — Netflix is a streaming entertainment service offering a library of movies, TV shows, and original content accessible globally.
The company is based in Los Gatos, California.
More reports: NWSA · Q4 FY2026 · OMC · Q2 2026 · PSKY · Q2 2026 · RDDT · Q2 2026 · T · Q3 2026 · TKO · Q2 2026 · TMUS · Q2 2026 · TTWO · Q1 FY2027 · VZ · Q2 2026 · APP · Q2 2026 · all reports