← Who reports today · Health Care
TMO · Q2 2026
Archived report (Q2 2026). Latest deep dive →
The quarter in brief
A solid, broad-based quarter with revenue up 10% and GAAP operating margin expanding to 17.4%, powered by Laboratory Products & Biopharma Services (Clario acquisition, clinical research strength) and Analytical Instruments, though rising net interest expense from debt-funded M&A and buybacks partly offset operating gains at the net income line.
Net Income (TMO)
$1,736M
up 7.4% y/y
Revenue
$11,994M
up 10.5% y/y
Operating Income
$2,087M
up 13.8% y/y
Gross Profit
$4,882M
up 15.1% y/y
All figures in $M.
| Line item | Amount and change |
|---|---|
| Life Sciences Solutions | $2,815 · +13% |
| Analytical Instruments | $1,847 · +7% |
| Specialty Diagnostics | $1,205 · +6% |
| Laboratory Products & Biopharma Services | $6,693 · +12% |
| Revenue | $11,994 · +10.5% |
| Cost of Revenues | $7,112 · +7.7% |
| Gross Profit | $4,882 · +15.1% · 40.7% margin |
| SG&A | $2,333 · +9% |
| R&D | $364 · +3% |
| Restructuring & Other | $98 · +20% |
| Operating Income | $2,087 · +13.8% · 17.4% margin |
| Net Interest Expense | $194 · +81% |
| Other Income | $31 · vs -$19 |
| Pre-Tax Income | $1,924 · +12.6% |
| Income Tax | $167 · +82% |
| Equity in Losses* | -$15 · vs $2 |
| Noncontrolling Interests | $5 · +150% |
| Net Income (TMO) | $1,736 · +7.4% · $4.68 diluted EPS |
Verdict: a solid, broad-based quarter with revenue up 10% and GAAP operating margin expanding to 17.4%, powered by Laboratory Products & Biopharma Services (Clario acquisition, clinical research strength) and Analytical Instruments, though rising net interest expense from debt-funded M&A and buybacks partly offset operating gains at the net income line.
6M OCF $3,317M; free cash flow $2,503M (6M); $4,000M buybacks and $337M dividends paid in H1 2026; FY26 capex guided $1.9-2.1B; FY26 GAAP tax rate guided 9-11%.
Source and notation
* marks non-cash / ≈ estimated. Source: Thermo Fisher Scientific press release / 10-Q (SEC EDGAR).
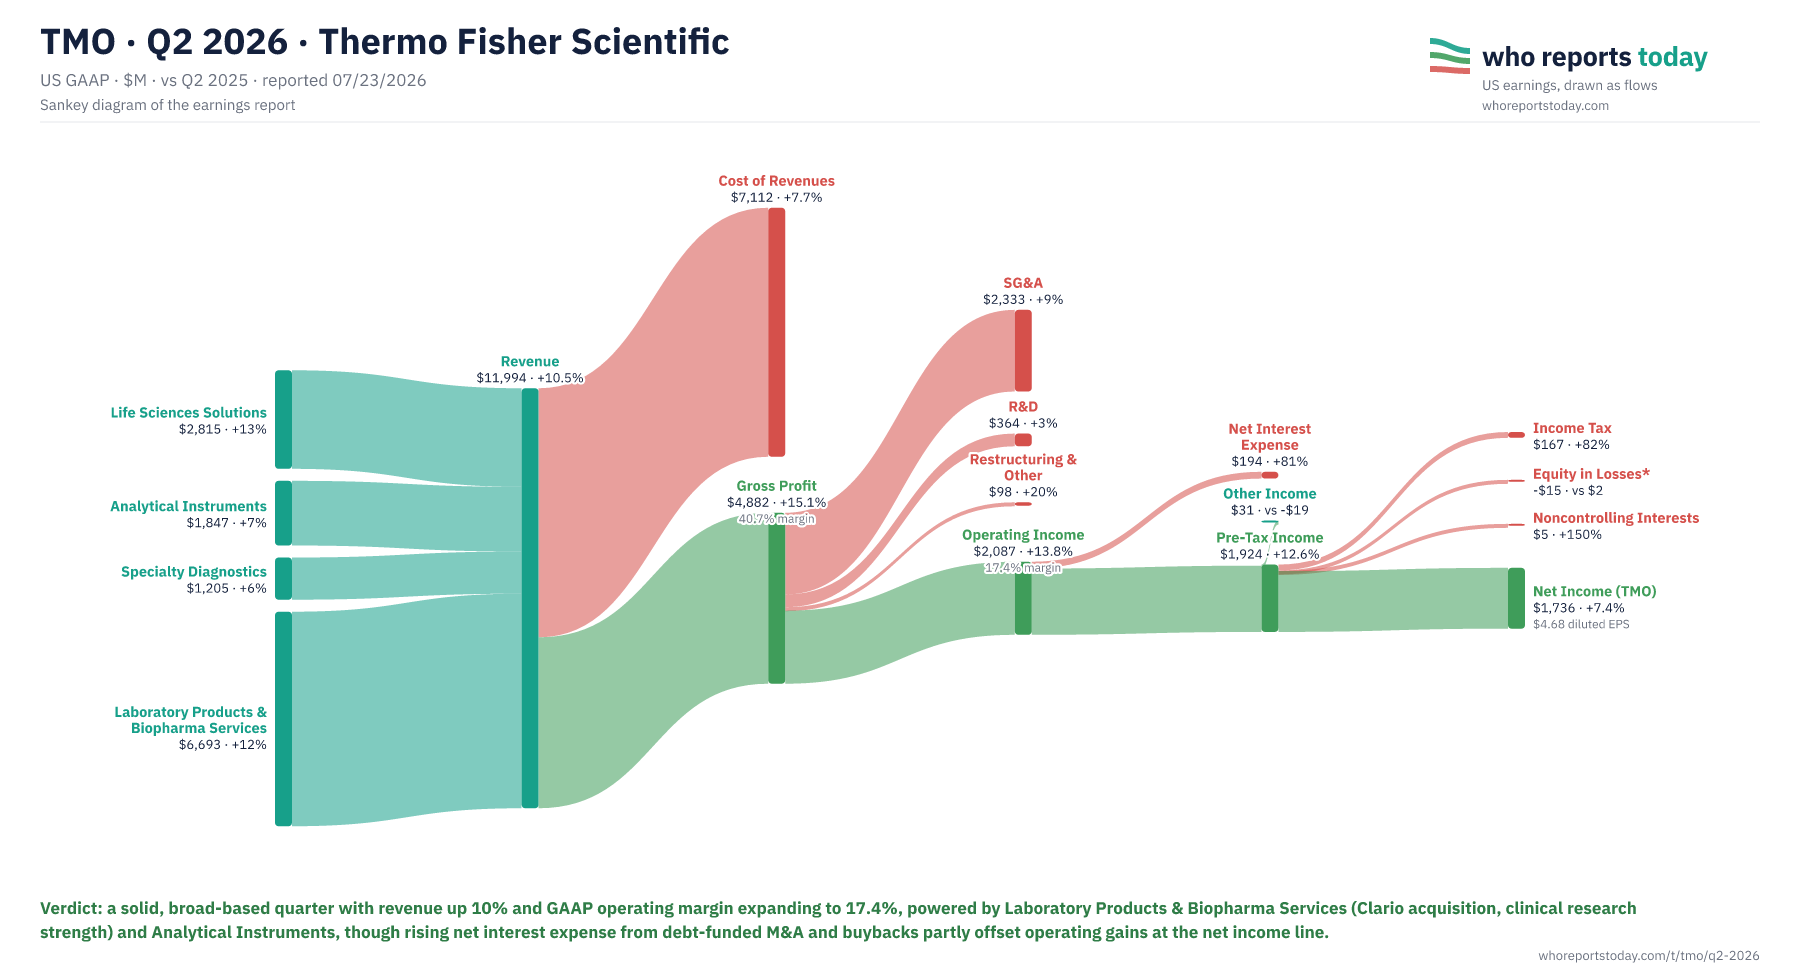
Cite / embed this chart
Free to use in articles, research and social posts with credit to Who Reports Today and a link — licensed under CC BY 4.0 (terms).
Chart: “TMO Q2 2026: where the revenue went” by Who Reports Today, https://whoreportstoday.com/t/tmo/q2-2026. Licensed under CC BY 4.0.
<figure>
  <a href="https://whoreportstoday.com/t/tmo/q2-2026"><img src="https://whoreportstoday.com/t/tmo/q2-2026/sankey.png" alt="TMO Q2 2026: where the revenue went" loading="lazy" style="max-width:100%;height:auto"></a>
  <figcaption>Source: <a href="https://whoreportstoday.com/t/tmo/q2-2026">Who Reports Today</a>, licensed under <a href="https://creativecommons.org/licenses/by/4.0/">CC BY 4.0</a></figcaption>
</figure>
https://whoreportstoday.com/t/tmo/q2-2026/sankey.png
<a href="https://whoreportstoday.com/t/tmo/q2-2026">TMO Q2 2026 earnings chart (Who Reports Today)</a>
This is an archived report: the image at this link won’t change. If you change the chart (crop, translate), say so in the credit. Company logos and trademarks are not covered by the license.
- Revenue grew 10% reported but only 5% organic; acquisitions (notably Clario, closed 3/24/26) added ~5 pts and FX added ~1 pt.
- Adjusted operating income of $2,735M (22.8% margin) excludes $485M of acquisition-intangible amortization and $98M of restructuring/other costs, well above GAAP operating income of $2,087M (17.4% margin).
- Net interest expense rose to $194M from $107M y/y, driven by debt issued for the Clario acquisition, buybacks and dividends, a headwind below the operating line.
- GAAP tax rate of only 8.7% reflects a $148M one-time deferred tax benefit from realized deferred tax assets in certain jurisdictions, masking a higher underlying adjusted tax rate of 11.6%.
- Laboratory Products & Biopharma Services led growth (+12% reported, +5% organic) on clinical research strength (Clario) and pharma services; Analytical Instruments segment income margin jumped 4.2pts on strong volume leverage and productivity.
- Company agreed to divest its Microbiology business (~$1.075B) in April 2026, expected to close Q3 2026, while continuing to fund M&A with debt (total debt rose to $42.5B from $39.4B).
What distorts the picture in this report and what to watch beyond the headlines.
TMO — Thermo Fisher Scientific provides analytical instruments, laboratory equipment, reagents, and software for research and healthcare.
The company is headquartered in Waltham, Massachusetts, and serves customers worldwide.
Heads-up
- debt load increased (Q2 2026)
Most likely because net interest expense rose to $194M from $107M y/y, driven by debt issued for the Clario acquisition, buybacks and dividends, a headwind below the operating line; revenue grew 10% reported but only 5% organic; acquisitions (notably Clario, closed 3/24/26) added ~5 pts and FX added ~1 pt. Based on the Q2 2026 report.
Company filings on SEC EDGAR ↗More reports: UHS · Q2 2026 · UNH · Q3 2026 · VEEV · Q2 FY2027 · VRTX · Q2 2026 · VTRS · Q2 2026 · WAT · Q2 2026 · WST · Q2 2026 · ZBH · Q2 2026 · ZTS · Q2 2026 · A · Q3 FY2026 · all reports