← Who reports today · Financials
COF · Q2 2026
Archived report (Q2 2026). Latest deep dive →
The quarter in brief
A strong quarter with net income swinging to $3.0 billion from a year-ago net loss driven by lower credit provisions and steady net interest margin expansion, though rising marketing and integration costs are eating into pre-provision earnings growth.
Net Income
$3,020M
Total Net Revenue
$15,850M
up 26.9% y/y
Non-Interest Expense
$9,043M
up 29.4% y/y
All figures in $M.
| Line item | Amount and change |
|---|---|
| Net Interest Income | $12,374 · +23.8% |
| Non-Interest Income | $3,476 · +39.2% |
| Total Net Revenue | $15,850 · +26.9% |
| Provision for Credit Losses | $2,989 · -73.8% |
| Non-Interest Expense | $9,043 · +29.4% |
| Pre-Tax Income | $3,818 · vs -$5,929 |
| Income Tax | $798 |
| Net Income | $3,020 · vs -$4,277 · $4.73 per diluted share |
Verdict: a strong quarter with net income swinging to $3.0 billion from a year-ago net loss driven by lower credit provisions and steady net interest margin expansion, though rising marketing and integration costs are eating into pre-provision earnings growth.
CET1 ratio 13.7%; net charge-offs $3,600M with $662M reserve release; NIM 8.01% (+14bps); efficiency ratio 57.05% (adjusted 51.38%).
Source and notation
* marks non-cash / ≈ estimated. Source: Capital One Financial press release / 10-Q (SEC EDGAR).
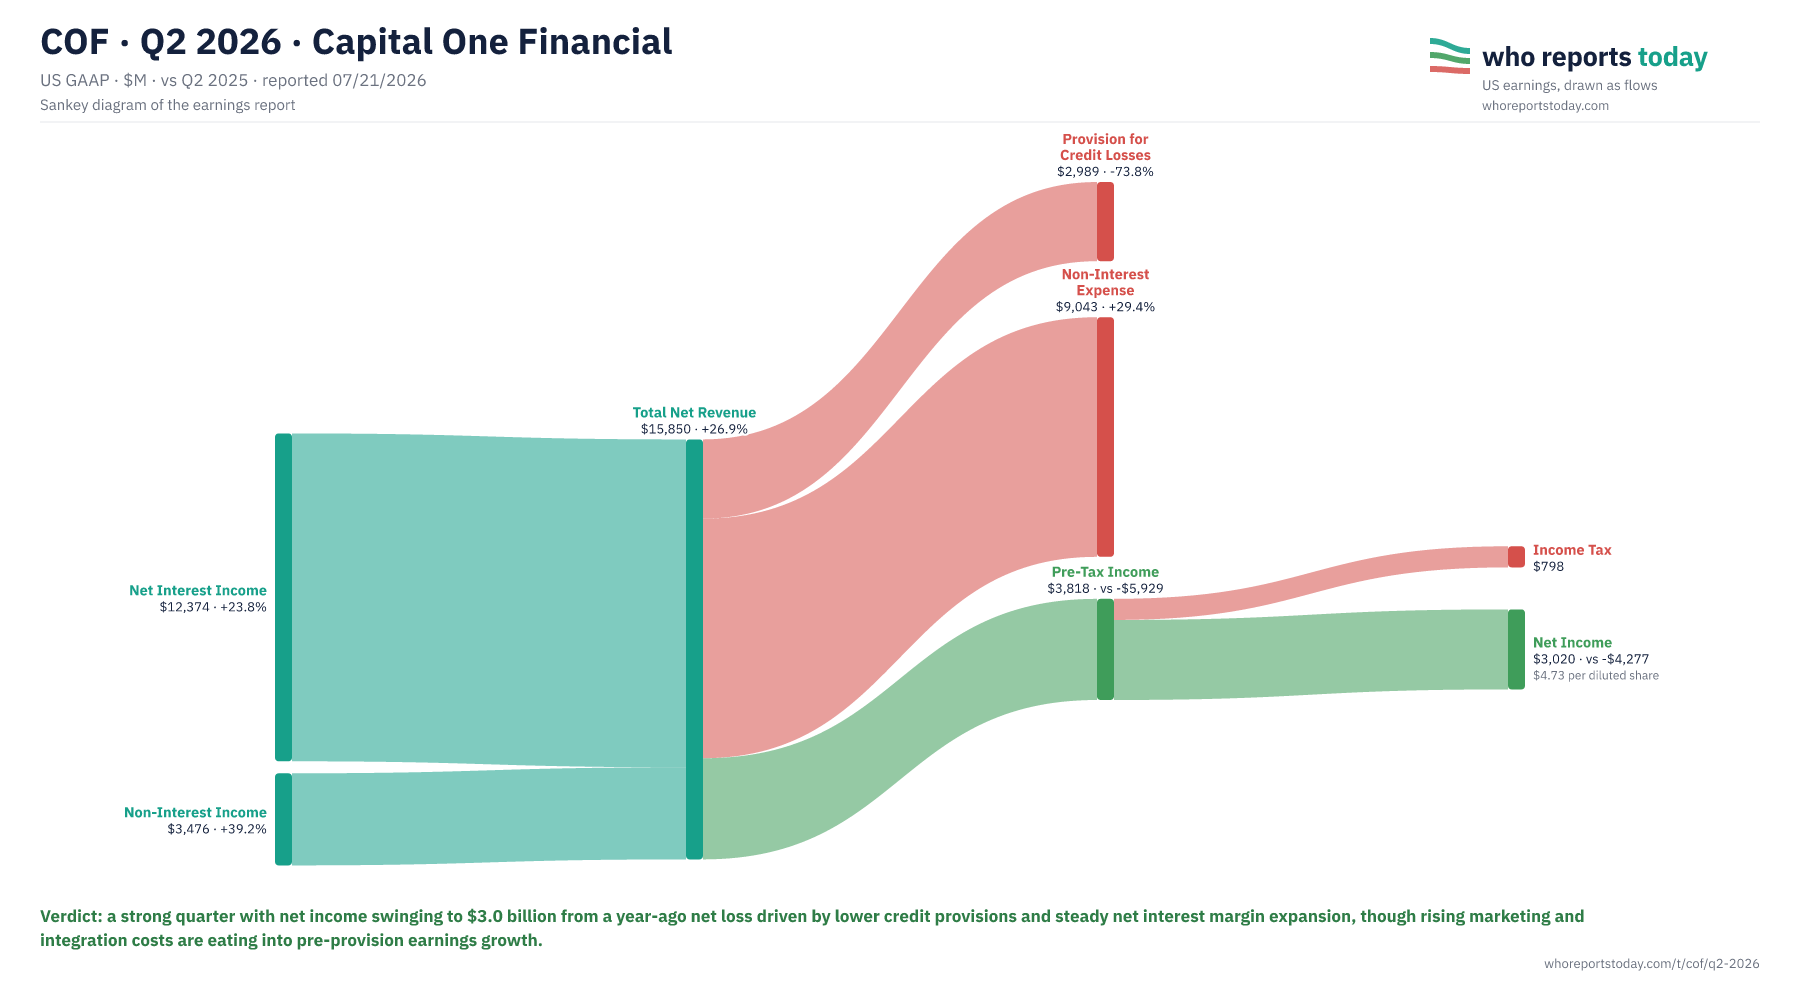
Cite / embed this chart
Free to use in articles, research and social posts with credit to Who Reports Today and a link — licensed under CC BY 4.0 (terms).
Chart: “COF Q2 2026: where the revenue went” by Who Reports Today, https://whoreportstoday.com/t/cof/q2-2026. Licensed under CC BY 4.0.
<figure>
  <a href="https://whoreportstoday.com/t/cof/q2-2026"><img src="https://whoreportstoday.com/t/cof/q2-2026/sankey.png" alt="COF Q2 2026: where the revenue went" loading="lazy" style="max-width:100%;height:auto"></a>
  <figcaption>Source: <a href="https://whoreportstoday.com/t/cof/q2-2026">Who Reports Today</a>, licensed under <a href="https://creativecommons.org/licenses/by/4.0/">CC BY 4.0</a></figcaption>
</figure>
https://whoreportstoday.com/t/cof/q2-2026/sankey.png
<a href="https://whoreportstoday.com/t/cof/q2-2026">COF Q2 2026 earnings chart (Who Reports Today)</a>
This is an archived report: the image at this link won’t change. If you change the chart (crop, translate), say so in the credit. Company logos and trademarks are not covered by the license.
- Q2 2025 comparison is distorted by a $4.3B net loss tied to Discover acquisition-related provisioning, making y/y net income comparisons not meaningful on a like-for-like basis; Discover was consolidated only from May 18, 2025, so revenue growth of 27% and expense growth of 29% also reflect a full quarter of Discover.
- Adjusted EPS of $5.81 excludes $494M acquisition amortization, $298M Discover integration expenses, and $96M Brex integration expenses — a large non-GAAP vs GAAP gap ($4.73 reported EPS).
- Provision for credit losses fell $1.1B q/q to $3.0B, including a $662M loan reserve release, a key swing factor for the profit improvement.
- Non-interest expense rose 7% q/q to $9.0B, with marketing up 11% and operating expenses up 6%, pressuring pre-provision earnings which grew only 1% q/q.
- Credit Card period-end loans grew 2% to $275.4B and Consumer Banking loans grew 4% to $90.5B, showing broad-based loan growth across segments 14 months into Discover integration.
- Total assets reached $673.8B and deposits $484.3B, reflecting the enlarged balance sheet post-Discover acquisition.
What distorts the picture in this report and what to watch beyond the headlines.
COF — Capital One Financial is a US-based bank holding company offering banking, credit card, and financial services to consumers and businesses.
It operates primarily in the United States with headquarters in McLean, Virginia.
More reports: COIN · Q2 2026 · CPAY · Q2 2026 · EG · Q2 2026 · ERIE · Q2 2026 · FDS · Q4 FY2026 · FIS · Q2 2026 · FISV · Q2 2026 · FITB · Q3 2026 · GL · Q2 2026 · GPN · Q2 2026 · all reports