HAL · Q2 2026
Archived report (Q2 2026). Latest deep dive →
The quarter in brief
Revenue grew 3.7% y/y to $5.71B, operating margin 13.6% vs 13.2%, net income $534M (+13.1% y/y).
Net income attributable to company
$534M
up 13.1% y/y
Total revenue
$5,714M
up 3.7% y/y
Total operating income
$778M
up 7.0% y/y
All figures in $M.
| Line item | Amount and change |
|---|---|
| Completion and Production | $3,202 · +1.0% |
| Drilling and Evaluation | $2,512 · +7.4% |
| Total revenue | $5,714 · +3.7% |
| Segment operating costs (calculated) | $4,902 · +4.6% |
| Corporate and other, SAP S4 upgrade expense, impairments and other credits (calculated) | $34 · −65.3% |
| Total operating income | $778 · +7.0% · 13.6% margin |
| Interest expense, net | $83 · −9.8% |
| Other, net | $31 · +29.2% |
| Income before income taxes | $664 · +8.7% |
| Income tax provision | $126 · −3.8% · 19.0% effective rate |
| Net income attributable to noncontrolling interest | $4 · −50.0% |
| Net income attributable to company | $534 · +13.1% · $0.64/sh · 9.3% margin |
Verdict: revenue grew 3.7% y/y to $5.71B, operating margin 13.6% vs 13.2%, net income $534M (+13.1% y/y).
Diluted EPS $0.64 vs $0.55 a year earlier; adjusted net income excluding impairments and other credits $461 million, or $0.55 per share; adjusted operating income $683 million (non-GAAP).
Source and notation
Source: Halliburton earnings release, 8-K EX-99 of 07/21/2026 (SEC EDGAR). The income statement lines were taken from the release by hand; the program found every figure in the release text and checked the accounting identities and the chart balance; revenue and net income match SEC XBRL.
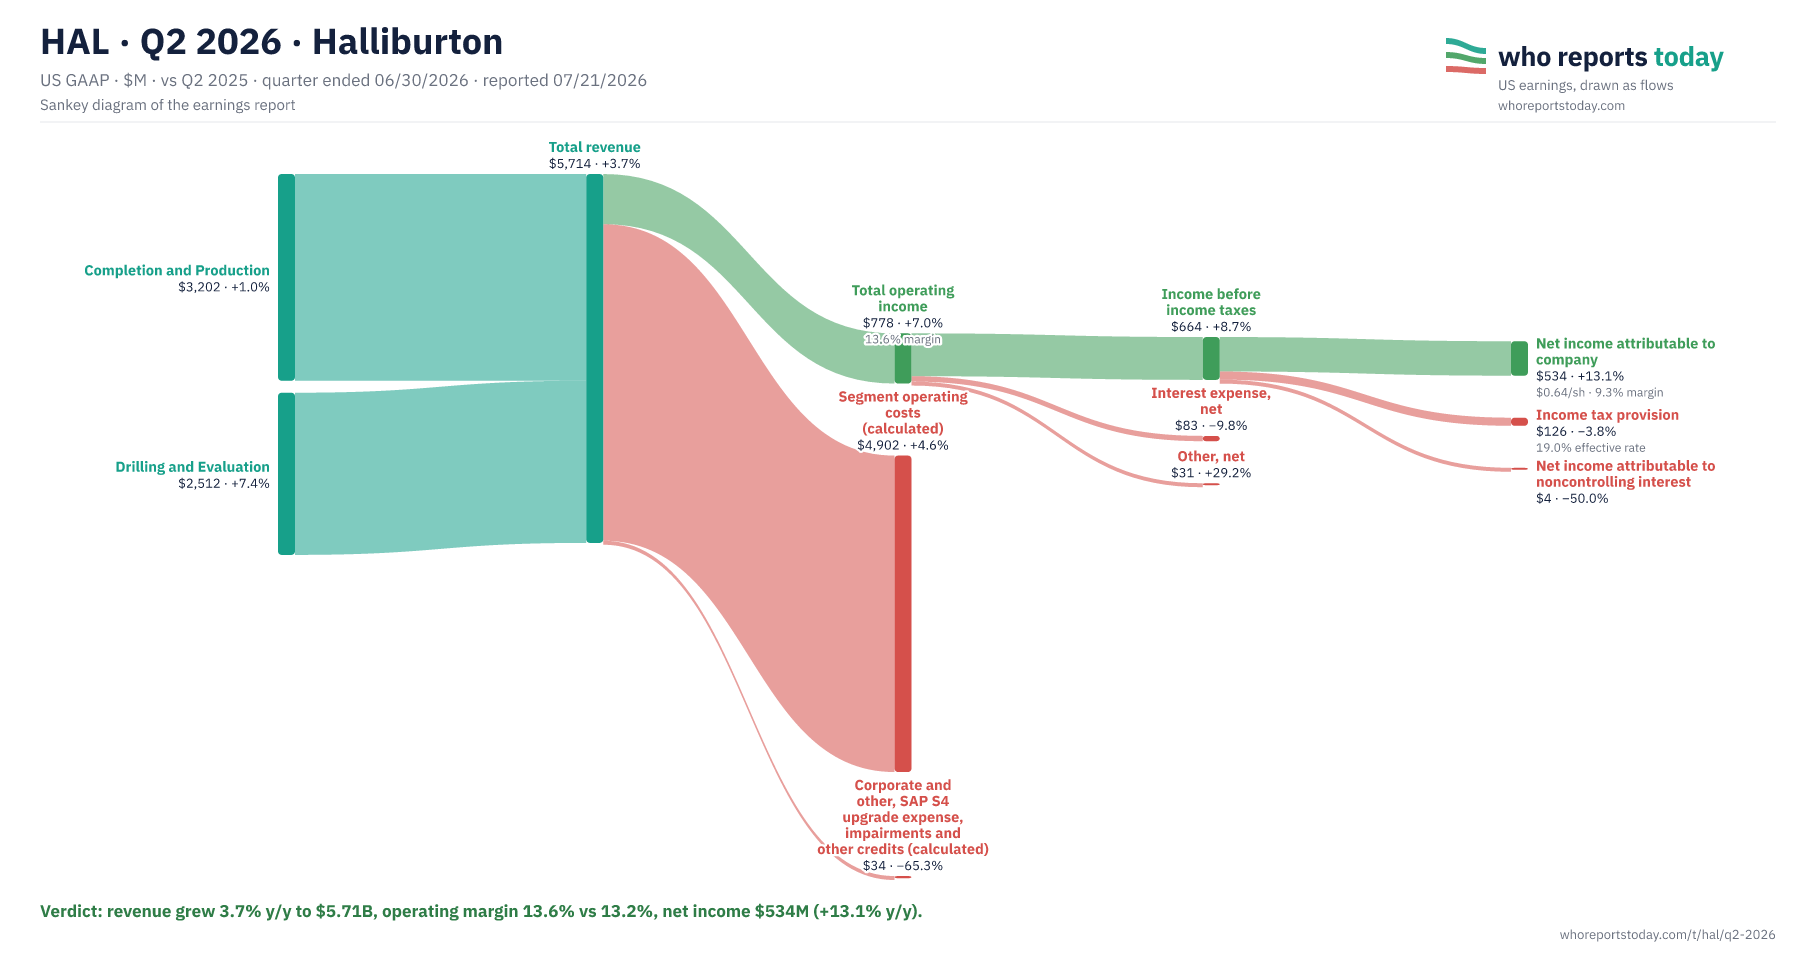
Cite / embed this chart
Free to use in articles, research and social posts with credit to Who Reports Today and a link — licensed under CC BY 4.0 (terms).
Chart: “HAL Q2 2026: where the revenue went” by Who Reports Today, https://whoreportstoday.com/t/hal/q2-2026. Licensed under CC BY 4.0.
<figure>
  <a href="https://whoreportstoday.com/t/hal/q2-2026"><img src="https://whoreportstoday.com/t/hal/q2-2026/sankey.png" alt="HAL Q2 2026: where the revenue went" loading="lazy" style="max-width:100%;height:auto"></a>
  <figcaption>Source: <a href="https://whoreportstoday.com/t/hal/q2-2026">Who Reports Today</a>, licensed under <a href="https://creativecommons.org/licenses/by/4.0/">CC BY 4.0</a></figcaption>
</figure>
https://whoreportstoday.com/t/hal/q2-2026/sankey.png
<a href="https://whoreportstoday.com/t/hal/q2-2026">HAL Q2 2026 earnings chart (Who Reports Today)</a>
This is an archived report: the image at this link won’t change. If you change the chart (crop, translate), say so in the credit. Company logos and trademarks are not covered by the license.
- Operating income includes a $95 million credit from impairments and other items, partly offset by $46 million of SAP S4 upgrade expense.
- Drilling and Evaluation revenue rose to $2,512M from $2,339M on drilling-related services and wireline activity.
- Operating income was $778M, a 13.6% margin vs 13.2% a year earlier.
- The effective tax rate was 19.0% vs 21.4% a year earlier.
- Diluted EPS was $0.64 vs $0.55 a year earlier.
What distorts the picture in this report and what to watch beyond the headlines.
HAL — Halliburton is one of the largest oilfield services companies, with two segments: Completion and Production, and Drilling and Evaluation.
Headquarters: Houston, Texas.
More reports: KMI · Q2 2026 · MPC · Q2 2026 · OKE · Q2 2026 · OXY · Q2 2026 · PSX · Q2 2026 · SLB · Q2 2026 · TPL · Q2 2026 · TRGP · Q2 2026 · VLO · Q2 2026 · WMB · Q2 2026 · all reports