← Who reports today · Financials
MCO · Q2 2026
Archived report (Q2 2026). Latest deep dive →
The quarter in brief
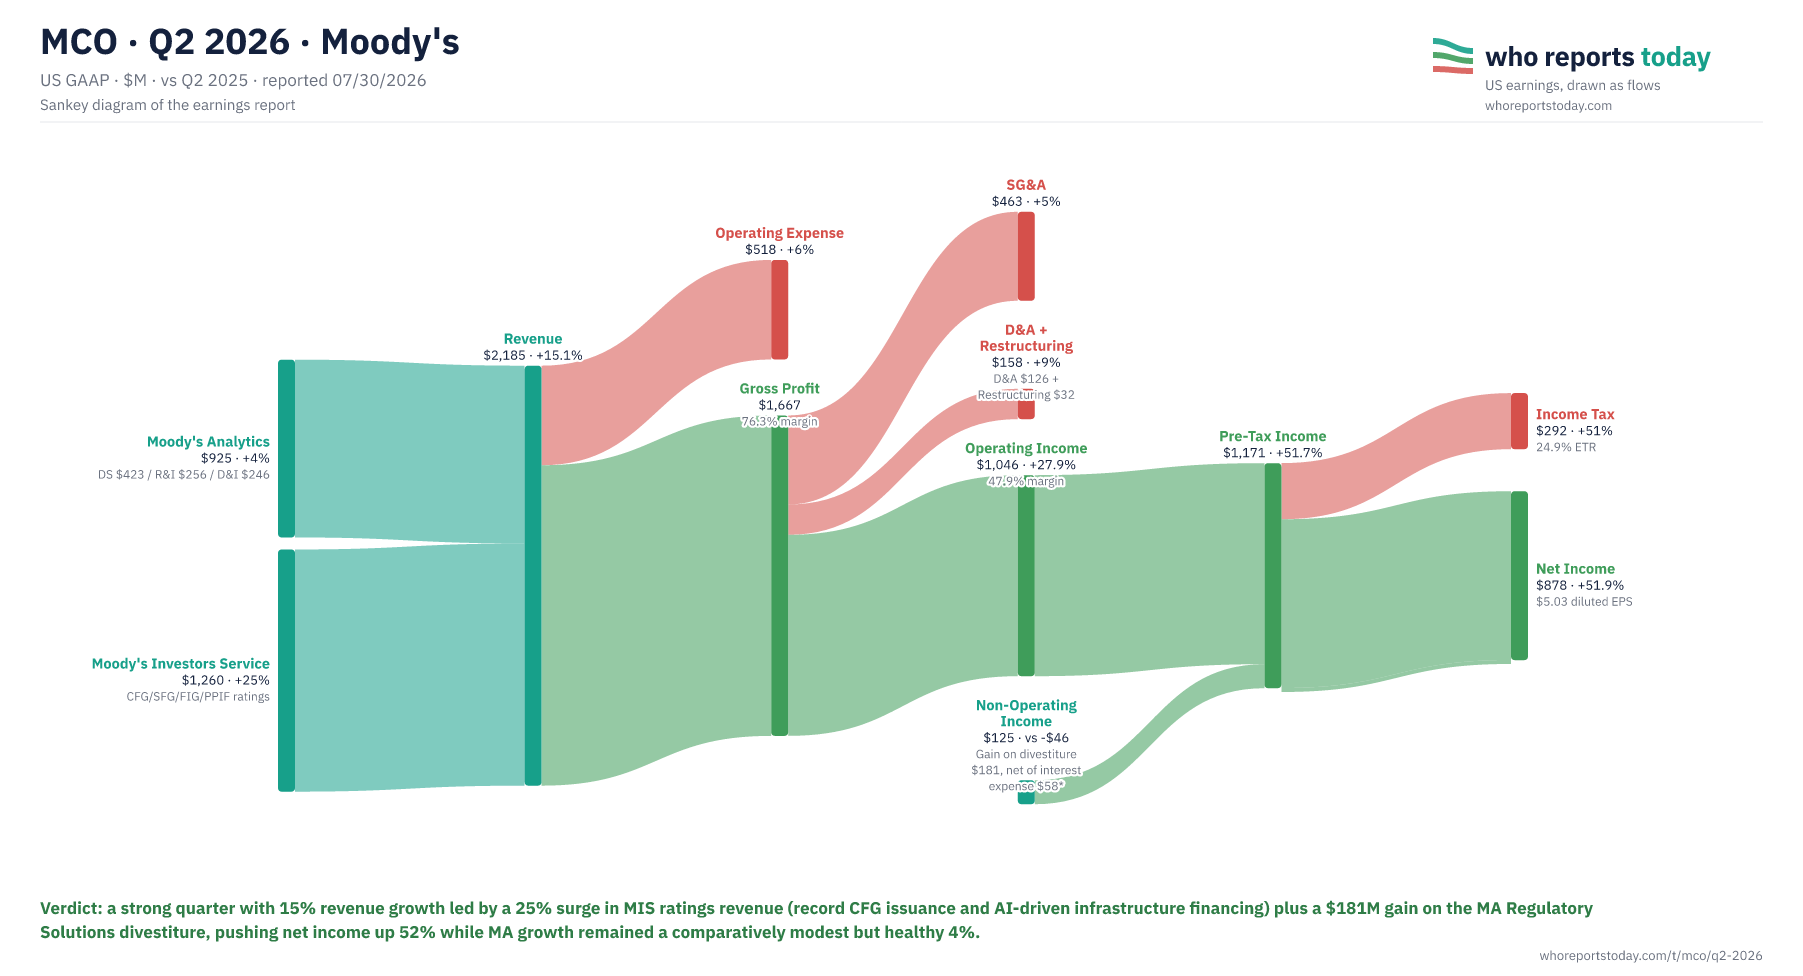
A strong quarter with 15% revenue growth led by a 25% surge in MIS ratings revenue (record CFG issuance and AI-driven infrastructure financing) plus a $181M gain on the MA Regulatory Solutions divestiture, pushing net income up 52% while MA growth remained a comparatively modest but healthy 4%.
Net Income
$878M
up 51.9% y/y
Revenue
$2,185M
up 15.1% y/y
Operating Income
$1,046M
up 27.9% y/y
Gross Profit
$1,667M
All figures in $M.
| Line item | Amount and change |
|---|---|
| Moody's Analytics | $925 · +4% · DS $423 / R&I $256 / D&I $246 |
| Moody's Investors Service | $1,260 · +25% · CFG/SFG/FIG/PPIF ratings |
| Revenue | $2,185 · +15.1% |
| Operating Expense | $518 · +6% |
| Gross Profit | $1,667 · 76.3% margin |
| SG&A | $463 · +5% |
| D&A + Restructuring | $158 · +9% · D&A $126 + Restructuring $32 |
| Operating Income | $1,046 · +27.9% · 47.9% margin |
| Non-Operating Income | $125 · vs -$46 · Gain on divestiture $181, net of interest expense $58* |
| Pre-Tax Income | $1,171 · +51.7% |
| Income Tax | $292 · +51% · 24.9% ETR |
| Net Income | $878 · +51.9% · $5.03 diluted EPS |
Verdict: a strong quarter with 15% revenue growth led by a 25% surge in MIS ratings revenue (record CFG issuance and AI-driven infrastructure financing) plus a $181M gain on the MA Regulatory Solutions divestiture, pushing net income up 52% while MA growth remained a comparatively modest but healthy 4%.
OCF $1,718M (+$418M YoY); Free Cash Flow $1,532M; treasury share repurchases $2,184M YTD (~$701M in Q2); quarterly dividend $1.03/share; $1.8B remaining buyback authority.
Source and notation
* marks non-cash / ≈ estimated. Source: Moody's Corporation press release / 10-Q (SEC EDGAR).
Cite / embed this chart
Free to use in articles, research and social posts with credit to Who Reports Today and a link — licensed under CC BY 4.0 (terms).
Chart: “MCO Q2 2026: where the revenue went” by Who Reports Today, https://whoreportstoday.com/t/mco/q2-2026. Licensed under CC BY 4.0.
<figure>
  <a href="https://whoreportstoday.com/t/mco/q2-2026"><img src="https://whoreportstoday.com/t/mco/q2-2026/sankey.png" alt="MCO Q2 2026: where the revenue went" loading="lazy" style="max-width:100%;height:auto"></a>
  <figcaption>Source: <a href="https://whoreportstoday.com/t/mco/q2-2026">Who Reports Today</a>, licensed under <a href="https://creativecommons.org/licenses/by/4.0/">CC BY 4.0</a></figcaption>
</figure>
https://whoreportstoday.com/t/mco/q2-2026/sankey.png
<a href="https://whoreportstoday.com/t/mco/q2-2026">MCO Q2 2026 earnings chart (Who Reports Today)</a>
This is an archived report: the image at this link won’t change. If you change the chart (crop, translate), say so in the credit. Company logos and trademarks are not covered by the license.
- Non-operating income swung from -$46M to +$125M mainly due to a $181M pre-tax gain on the MA Regulatory Solutions divestiture, a one-off boosting GAAP net income disproportionately vs Adjusted metrics
- Adjusted Diluted EPS of $4.68 (+31%) grew slower than GAAP Diluted EPS of $5.03 (+57%) because the divestiture gain, restructuring charges, and intangible amortization are excluded from the non-GAAP figure
- MIS revenue (+25%) significantly outpaced MA (+4%), driven by strong Corporate Finance issuance (leveraged finance, investment-grade AI-related hyperscaler financing) and Public/Project Infrastructure Finance (data centers)
- MA growth was muted by the Q4 2025 MA Learning Solutions and Q2 2026 MA Regulatory Solutions divestitures; excluding these, organic constant currency MA revenue grew 8%
- Restructuring charges of $32M continue under the Strategic and Operational Efficiency Restructuring Program (expanded July 2026), targeting $300-350M annualized savings by 2027-2028
- Operating margin expanded 480bps to 47.9% and Adjusted Operating Margin to 55.3%, reflecting strong operating leverage as revenue growth outpaced the 5% rise in operating and SG&A expenses
What distorts the picture in this report and what to watch beyond the headlines.
MCO — Moody's Corporation provides credit ratings, research, and risk analysis services.
It operates through its subsidiaries Moody's Investors Service and Moody's Analytics, serving global financial markets from its base in New York, USA.
More reports: MET · Q2 2026 · MRSH · Q3 2026 · MS · Q3 2026 · MSCI · Q3 2026 · MTB · Q3 2026 · NDAQ · Q2 2026 · NTRS · Q3 2026 · PFG · Q2 2026 · PGR · Q3 2026 · PNC · Q3 2026 · all reports