← Who reports today · Financials
NTRS · Q2 2026
Archived report (Q2 2026). Latest deep dive →
The quarter in brief
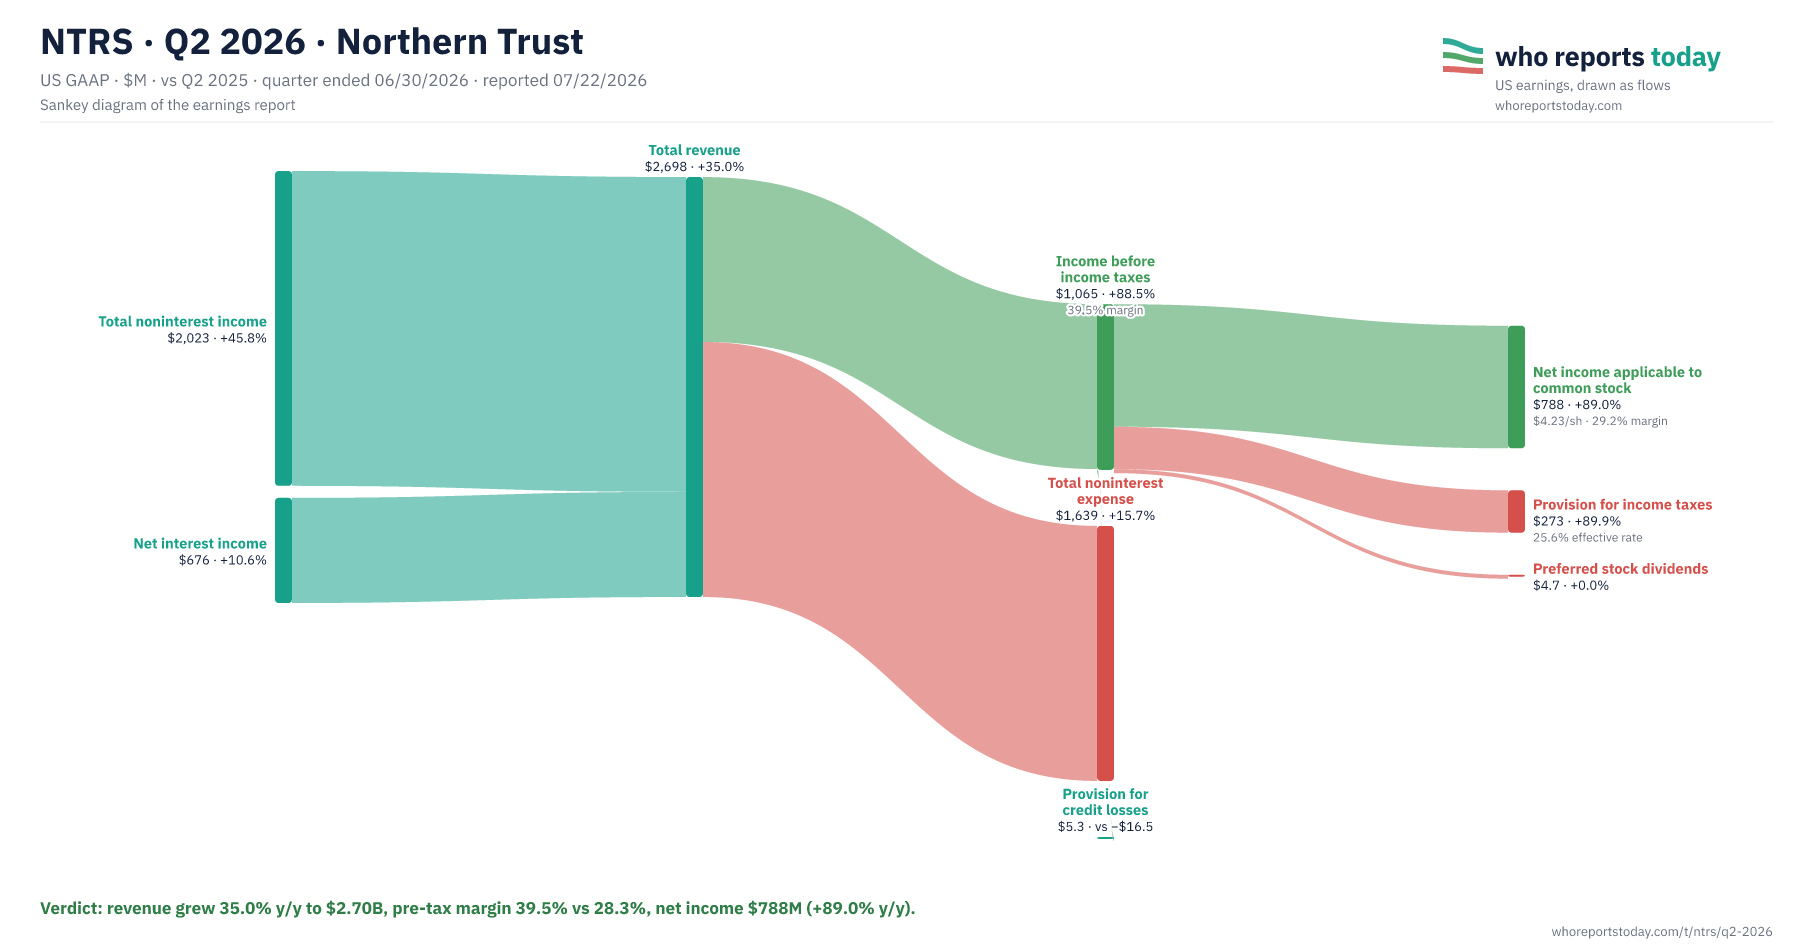
Revenue grew 35.0% y/y to $2.70B, pre-tax margin 39.5% vs 28.3%, net income $788M (+89.0% y/y).
Net income applicable to common stock
$788M
up 89.0% y/y
Total revenue
$2,698M
up 35.0% y/y
All figures in $M.
| Line item | Amount and change |
|---|---|
| Total noninterest income | $2,023 · +45.8% |
| Net interest income | $676 · +10.6% |
| Total revenue | $2,698 · +35.0% |
| Total noninterest expense | $1,639 · +15.7% |
| Provision for credit losses | $5.3 · vs −$16.5 |
| Income before income taxes | $1,065 · +88.5% · 39.5% margin |
| Provision for income taxes | $273 · +89.9% · 25.6% effective rate |
| Preferred stock dividends | $4.7 · +0.0% |
| Net income applicable to common stock | $788 · +89.0% · $4.23/sh · 29.2% margin |
Verdict: revenue grew 35.0% y/y to $2.70B, pre-tax margin 39.5% vs 28.3%, net income $788M (+89.0% y/y).
Diluted EPS $4.23 vs $2.13 a year earlier; return on average common equity 25.9%; assets under custody/administration $20,000.2 billion and assets under management $1,969.9 billion; quarterly dividend raised by $0.08, or 10%.
Source and notation
Source: Northern Trust earnings release and its exhibits, 8-K EX-99 of 07/22/2026 (SEC EDGAR). Bank layout: total revenue = net interest income + noninterest income; noninterest expense and the provision for credit losses are deducted to reach pre-tax income; preferred dividends separate net income from net income available to common shareholders. The income statement lines were taken from the release by hand; the program found every figure in the release text and checked the accounting identities and the chart balance; revenue and net income match SEC XBRL.
Cite / embed this chart
Free to use in articles, research and social posts with credit to Who Reports Today and a link — licensed under CC BY 4.0 (terms).
Chart: “NTRS Q2 2026: where the revenue went” by Who Reports Today, https://whoreportstoday.com/t/ntrs/q2-2026. Licensed under CC BY 4.0.
<figure>
  <a href="https://whoreportstoday.com/t/ntrs/q2-2026"><img src="https://whoreportstoday.com/t/ntrs/q2-2026/sankey.png" alt="NTRS Q2 2026: where the revenue went" loading="lazy" style="max-width:100%;height:auto"></a>
  <figcaption>Source: <a href="https://whoreportstoday.com/t/ntrs/q2-2026">Who Reports Today</a>, licensed under <a href="https://creativecommons.org/licenses/by/4.0/">CC BY 4.0</a></figcaption>
</figure>
https://whoreportstoday.com/t/ntrs/q2-2026/sankey.png
<a href="https://whoreportstoday.com/t/ntrs/q2-2026">NTRS Q2 2026 earnings chart (Who Reports Today)</a>
This is an archived report: the image at this link won’t change. If you change the chart (crop, translate), say so in the credit. Company logos and trademarks are not covered by the license.
- Noninterest income jumped to $2,022.5M from $1,387.4M, including a $525.4 million pre-tax gain from the second Visa, Inc. Exchange Offer and a $73.9 million loss on repositioning the securities portfolio.
- Noninterest expense rose 16% to $1,638.6M with $145.6 million of notable items: software dispositions, severance and a one-time equity grant to employees.
- Net interest income rose 11% to $675.5M.
- Pre-tax income was $1.06B, a 39.5% margin vs 28.3% a year earlier.
- The effective tax rate was 25.6% vs 25.4% a year earlier.
- Diluted EPS was $4.23 vs $2.13 a year earlier.
What distorts the picture in this report and what to watch beyond the headlines.
NTRS — Northern Trust provides asset servicing (custody and administration), asset management and wealth management for institutions and wealthy families.
Headquarters: Chicago, Illinois.
More reports: PFG · Q2 2026 · PGR · Q3 2026 · PNC · Q3 2026 · PRU · Q2 2026 · PYPL · Q2 2026 · RF · Q3 2026 · RJF · Q3 FY2026 · SCHW · Q3 2026 · SPGI · Q2 2026 · STT · Q3 2026 · all reports